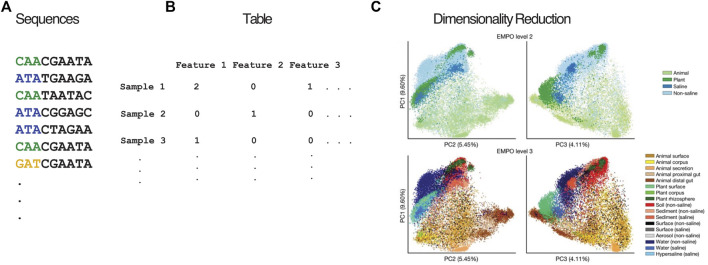
FIGURE 1.
Overview of dimensionality reduction pipeline. Nucleotide sequences (A) from a biological experiment are organized in a feature table (B) containing the abundance of each feature (e.g., OTU, ASV, MAG) in each sample. (C) Beta diversity plots showing unweighted UniFrac coordinates of EMP annotated by EMPO levels 2 and 3. (C) is a derivative of Figure 2C from “A communal catalogue reveals Earth’s multiscale microbial diversity” by Thompson et al. (2017) used under CC BY 4.0.

