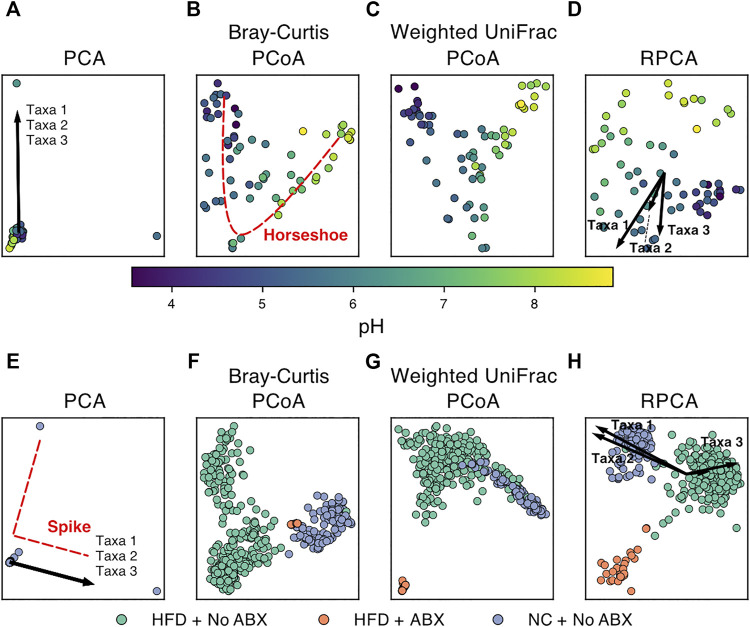
FIGURE 2.
Examples of dimensionality reduction techniques applied to publicly available microbiome data. (Top) Beta-diversity plots of soil samples colored by pH from (Lauber et al., 2009). (Bottom) Beta-diversity plots of murine fecal samples colored by diet and antibiotics usage from (Shalapour et al., 2017). (HFD = high-fat diet, NC = normal chow, ABX = antibiotics). PCA plots (A,E) show extremely high sample overlap due to outliers and characteristic “spike” artifacts. The top three taxa driving variation also overlap as shown by arrow superposition. (B) “Horseshoe” pattern emerges for samples following ecological gradients such as pH. RPCA plots (D,H) show the top three taxa driving separation of groups. (F) and (G) show strong overlap of HFD + ABX samples resolved by (H).

