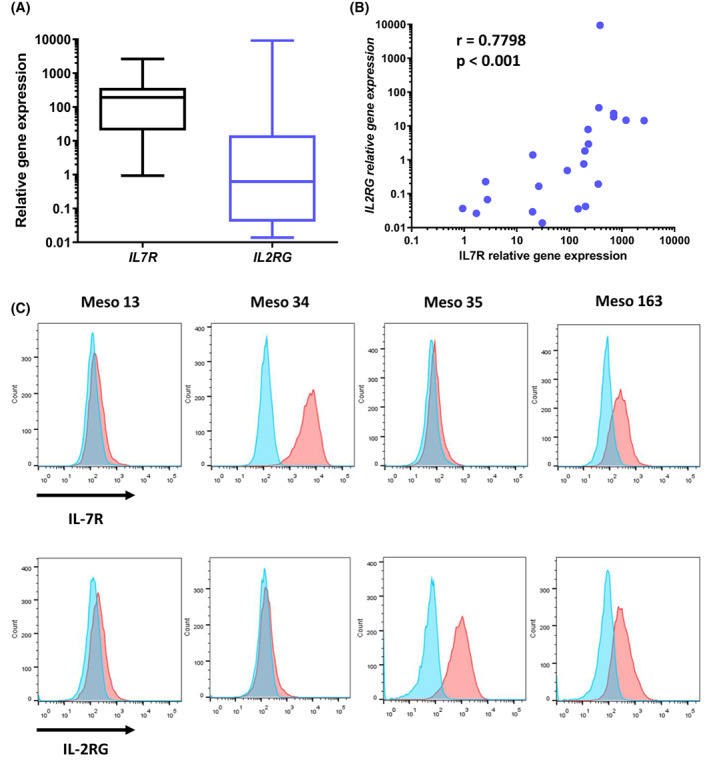
Fig. 2.

Analysis of IL‐7R and IL2RG expression in MPM cells (n = 22). (A) mRNA expression of IL7R and IL2RG as measured by RT‐PCR in MPM cells. Graphs are whiskers plots (min to max). The line in the middle of the box is plotted at the median. (B) Correlation between IL7R and IL2RG mRNA expression in MPM cells. Spearman test. (C) MPM cell surface expression of IL‐7R and IL‐2RG as determined by flow cytometry. Blue: Isotype controls, red: Anti‐IL‐7Rα (upper) or anti‐IL‐2Rγ (lower) antibody. MPM, malignant pleural mesothelioma.
