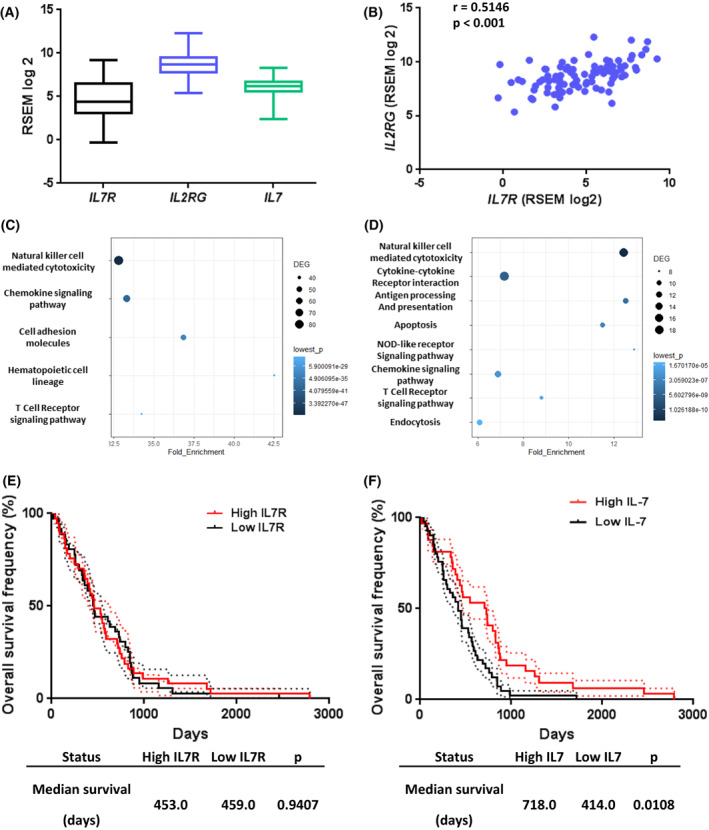
Fig. 4.

Expression of IL7R and IL2RG in MPM tumors (n = 87). RNASeq mRNA expression values were obtained from TCGA datasets. (A) mRNA expression of IL7R, IL2RG and IL7 in MPM tumors. Graphs are whiskers plots (min to max). The line in the middle of the box is plotted at the median. (B) Correlation between IL7R and IL2RG mRNA expression in MPM tumors. Spearman test. (C, D) Pathway enrichment analyses based on genes positively associated with IL7R (C) and IL7 (D) expression. (E, F) Patients were split into ‘high expression’ and ‘low expression’ groups based on the median of expression of IL7R (E) or IL7 (F) mRNA expression in MPM tumors. Differences in survival between groups were assessed using log‐rank tests. Dotted lines represent standard error interval. MPM, malignant pleural mesothelioma.
