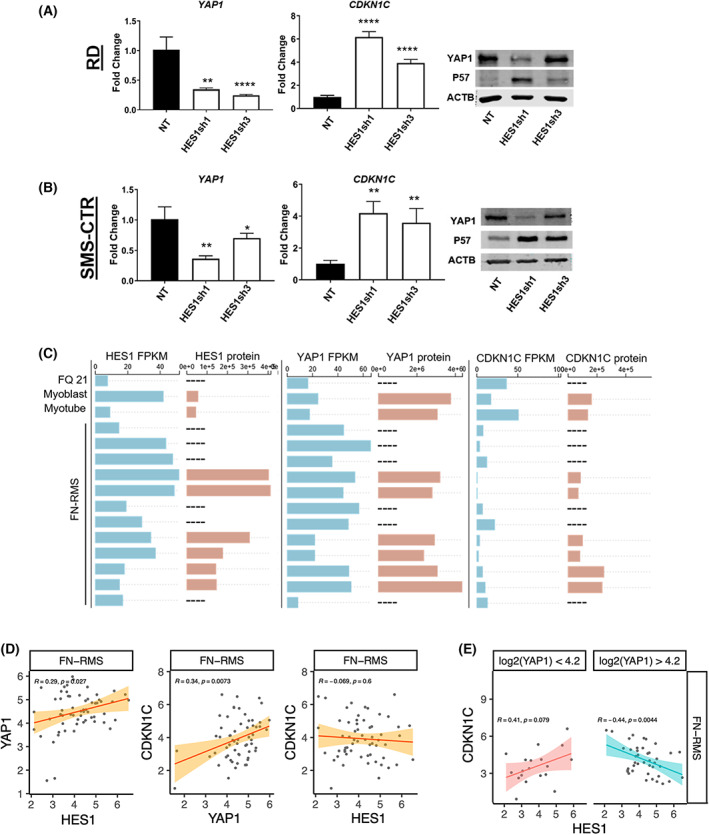
Fig. 2.

Identification of a HES1‐YAP1‐CDKN1C functional interaction in FN‐RMS. Depletion of Hes family BHLH transcription factor 1 (HES1) results in decreased Yes1 associated transcriptional regulator (YAP1) and increased cyclin‐dependent kinase inhibitor 1C (CDKN1C) mRNA expression in (A) RD and (B) SMS‐CTR cells, as assessed by quantitative reverse transcription PCR (RT‐qPCR); with n = 3; statistical significance determined by one‐way ANOVA with Brown‐Forsythe and Welch tests. Graph is representative with error bars indicating standard deviation (SD) of technical triplicate measurements. Immunoblots (right) (n = 2, representative image shown) show the expected increase in P57, the protein encoded by CDKN1C, but not the expected decrease in YAP1 protein, potentially reflecting feedback loops controlling YAP1 protein expression (see text). (C) Next‐generation RNA sequencing (RNA‐seq) from 12 fusion‐negative rhabdomyosarcoma (FN‐RMS) human tumor samples shows increased HES1 (left) and YAP1 (center) and decreased CDKN1C (right) message level (blue). The corresponding protein levels (orange) reflect a similar expression pattern for HES1 protein. Dashes indicate samples in which protein levels were not available. (D) Correlation of gene expression between HES1‐YAP1, YAP1‐CDKN1C, and HES1‐CDKN1C in an independent set of FN‐RMS tumor samples. Analysis was performed using the log2 transformed expression data directly from the NCI Oncogenomics database (https://omics‐oncogenomics.ccr.cancer.gov/). Correlations between HES1‐YAP1 and YAP1‐CDKN1C are positive with a significance level of P < 0.05 as determined by correlation tests using Pearson's correlation coefficient. (E) Further analysis of the dataset from (D) using the using the Bioconductor package LiquidAssociation demonstrates a significant three‐way interaction of transcription among the triplet of genes (P = 0.006). The three‐way interaction was visualized by dividing the data into low or high expression of YAP1 at a cut‐off of the median expression value of this gene (4.2) and then examining the correlations at different subsets as determined by correlation tests using Pearson's correlation coefficient. In low YAP1, there is a positive correlation between HES1 and CDKN1C; in high YAP1, there is a negative correlation between HES1 and CDKN1C. These results suggest that the relationship between HES1 and CDKN1C might be YAP1‐dependent. *P < 0.05; **P < 0.01; ****P < 0.0001.
