
Fig. 3.
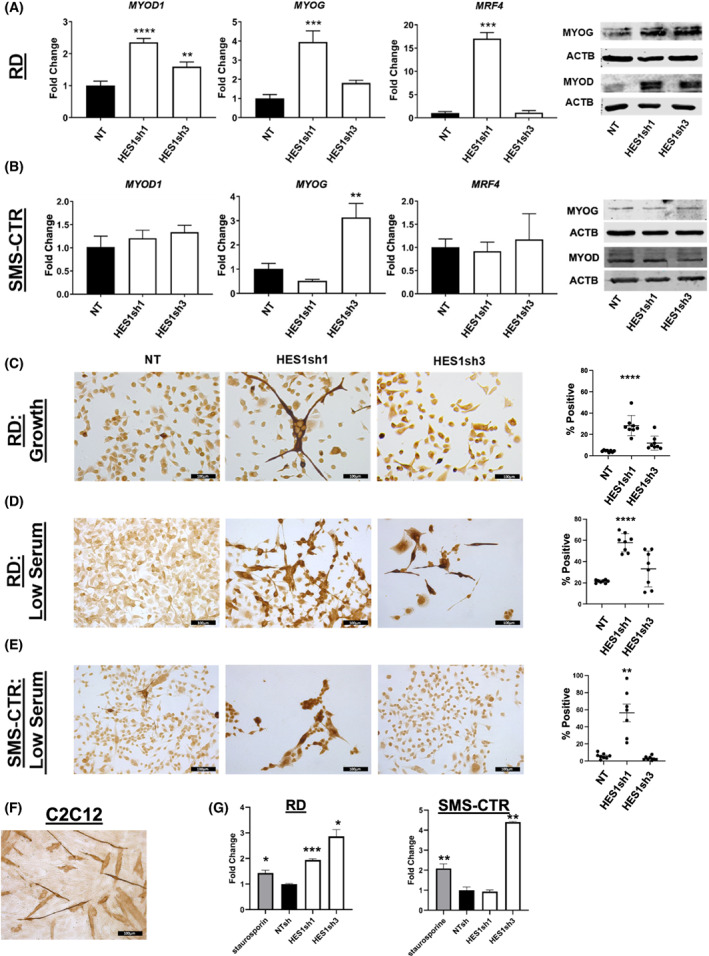
HES1 knockdown in vitro increases expression of myogenic markers and can lead to apoptosis. (A) Hes family BHLH transcription factor 1 (HES1) knock down in RD cells increased expression of myogenic differentiation 1 (MYOD1), Myogenin (MYOG), and muscle‐specific regulatory factor 4 (MRF4, encoded by the MYF6 gene) at the mRNA level [n = 3; statistical significance determined by one‐way ANOVA with Brown‐Forsythe and Welch tests; graph is representative with error bars indicating standard deviation (SD) of technical triplicate measurements], and MYOD1 and MYOG at the protein level (n = 2, representative image shown). (B) HES1 knockdown in SMS‐CTR increased expression of MYOG at the mRNA level [n = 3; statistical significance determined by one‐way ANOVA with Brown‐Forsythe and Welch tests; graph is representative with error bars indicating standard deviation (SD) of technical triplicate measurements] in cells expressing HES1sh3. This change was not observed at the protein level (n = 2, representative image shown). RD cells cultured in (C) standard growth (n = 8) or (D) differentiation‐inducing (low serum) conditions (n = 8) demonstrate increased myosin heavy chain (MHC) expression in response to HES1 inhibition, with HES1sh1 inducing a stronger phenotype than HES1sh3 that is amplified under differentiation‐inducing (low serum) conditions. (E) SMS‐CTR cells cultured in differentiation conditions (n = 8) demonstrate increased MHC positivity in response to HES1sh1. Graphs in C, D, and E depict mean with standard error of the mean (SEM); statistical significance determined by one‐way ANOVA with Brown‐Forsythe and Welch tests. (F) C2C12 murine myoblast cells are included as an MHC positive control (n = 3), since they are known to form myotubes under the differentiation conditions used here. Images are 200× total magnification with scale bars representing 100 μm for all images in this figure. (G) The Caspase 3/7 luminescence assay shows strong activity in HES1sh3 expressing cells in both RD and SMS‐CTR (n = 2; statistical significance determined by one‐way ANOVA with Brown‐Forsythe and Welch tests; graph is representative with error bars indicating SD of technical triplicate measurements). *P < 0.05; **P < 0.01; ***P < 0.001; ****P < 0.0001.