
Fig. 6.
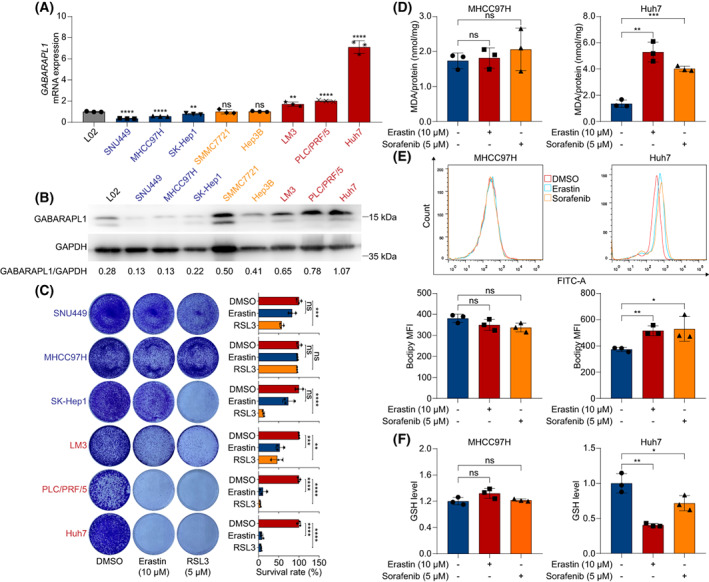
The expression of predicted GABARAPL1 sensitivity to ferroptosis in HCC. (A) The mRNA level of GABARAPL1 was determined using qRT‐PCR. (B) The protein level of GABARAPL1 was detected using western blotting. (C) Colony formation assay assessed the sensitivity of HCC cell lines to erastin and RSL3. (D) Indicated cells were treated with erastin or sorafenib for 24 h and MDA was determined. (E) Lipid ROS level of indicated HCC cells treated with erastin or sorafenib for 24 h. (F) Relative GSH level in indicated cells treated with erastin or sorafenib for 24 h. Data are shown as mean ± SD. All experiments were repeated three times. The t‐test was used to determine the differences between two groups. HCC, hepatocellular carcinoma; ROS, reactive oxygen species; GSH, glutathione. *P < 0.05, **P < 0.01, ***P < 0.001, ****P < 0.0001.