Fig. 7.

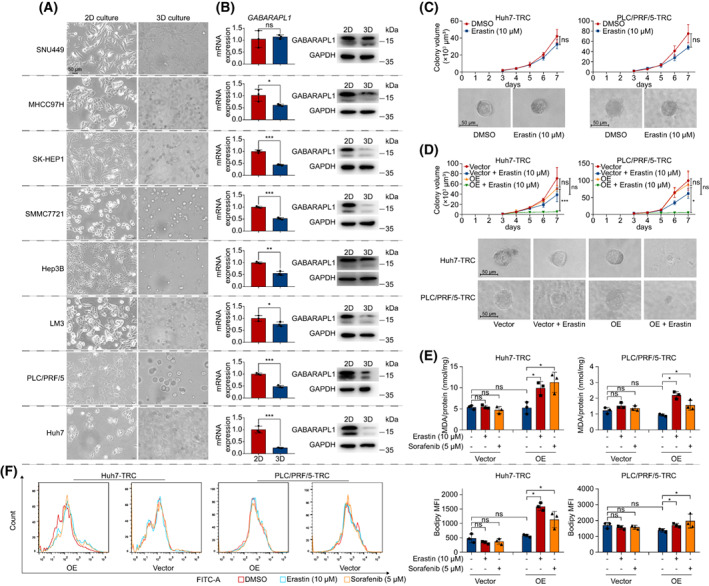
Downregulation of GABARAPL1 in HCC‐TRC involved in ferroptosis resistance. (A) Cell morphology of 2D and 3D cultured HCC cells. (B) The mRNA and protein level of GABARAPL1 in 2D cultured HCC cell and HCC TRC. (C) 2D cultured HCC cells were seeded in soft 3D fibrin gels to obtain TRC. On day 3, TRC were treated with erastin and then the colony spheroid was recorded on the next 4 days (days 3–7). The representative images of HCC‐TRC colony spheroids are from day 7. (D) Overexpression of GABARAPL1‐enhanced TRC sensitivity to erastin. (E, F) 2D cells were seeded in soft 3D fibrin gels and received lentivirus‐mediated transfection simultaneously. After 3 days, TRC were treated with erastin or sorafenib for 24 h. and the MDA (E) and lipid ROS (F) levels detected. Except western blot (n = 1), other experiments were independently repeated three times. Data were shown as mean ± SD. Statistics were performed by t‐test. Scale bar: 50 μm. HCC, hepatocellular carcinoma; ROS, reactive oxygen species; TRC, tumor‐repopulating cells. *P < 0.05, **P < 0.01, ***P < 0.001.
