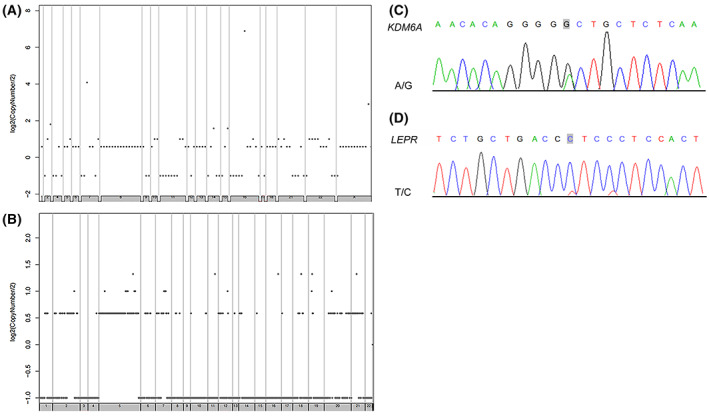
Fig. 9.

Chromosome plots and the Sanger sequencing results. (A) Chromosome plots showing copy number variation (CNV) results in case 1. (B) Chromosome plots showing CNV results in case 2. (C) Results of nucleotide Sanger sequencing analysis of KDM6A. Sanger sequencing electropherograms of the KDM6A mutant at position chromosome (Chr) X: 44928980 A>G. (D) Results of nucleotide Sanger sequencing analysis of LEPR. Sanger sequencing electropherograms of the LEPR mutant at position Chr1: 66096026T>C. All the experiments were repeated thrice independently.
