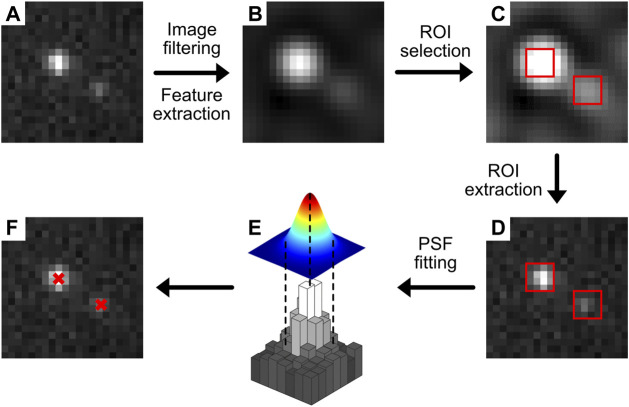
FIGURE 2.
Typical localization methodology. A raw image (A) is filtered to enhance features that likely contain emitters (B). From this filtered image, ROIs (red squares) are selected (C) and used to extract the PSF data from the original image (D). This region is then fitted by a PSF model (e.g. commonly a 2-dimensional Gaussian) (E), and the localizations with sub-pixel precision are displayed or used for further analysis (F).

