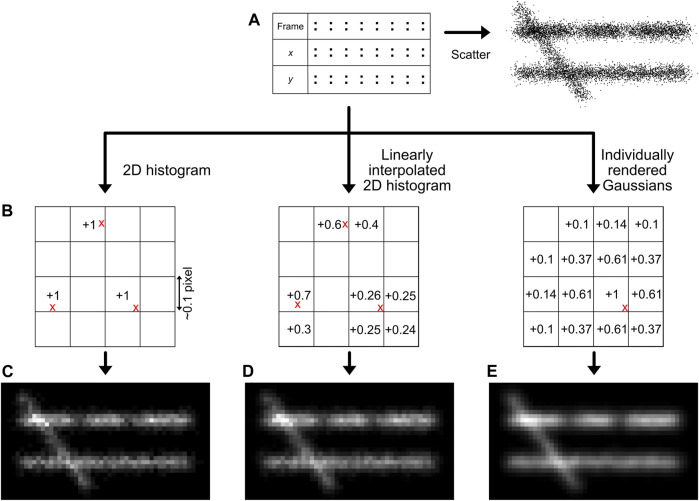
FIGURE 6.
Image generation methods. The simplest way for image generation is a scatter plot, although this does not reflect the localization density accurately (A). The localizations (red crosses) can also be placed on a sub-pixel grid (B), and the bin intensities can be increased based on the position of the localizations. The methods described in this manuscript are the creation of a 2D histogram (C), a linearly interpolated 2D histogram (D), or individually rendered Gaussians (E). Note the regions with lower density (66% lower density compared to the surrounding) and the different intensity between the two horizontal lines (30% lower density) that are more clearly interpreted by histogram images compared to a scatter visualisation.

