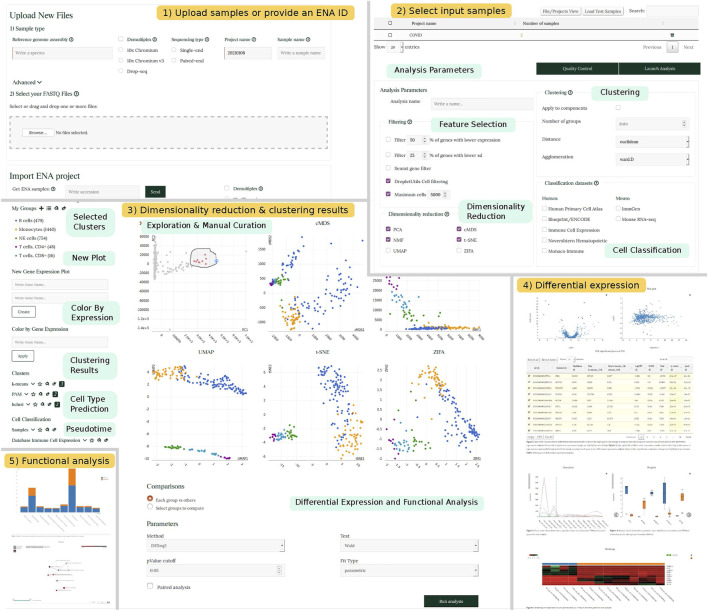
FIGURE 1.
SingleCAnalyzer Workflow. Schematic representation showing SingleCAnalyzer workflow example. Panel 1 and 2 show the web interface for setting input files and parameters. Panel 3 shows an example of visualization of dimensionality reduction, cellular type classification, pseudotime analysis and clustering results. Panels 4 and 5 show selected sections of differential expression and functional analysis results.

