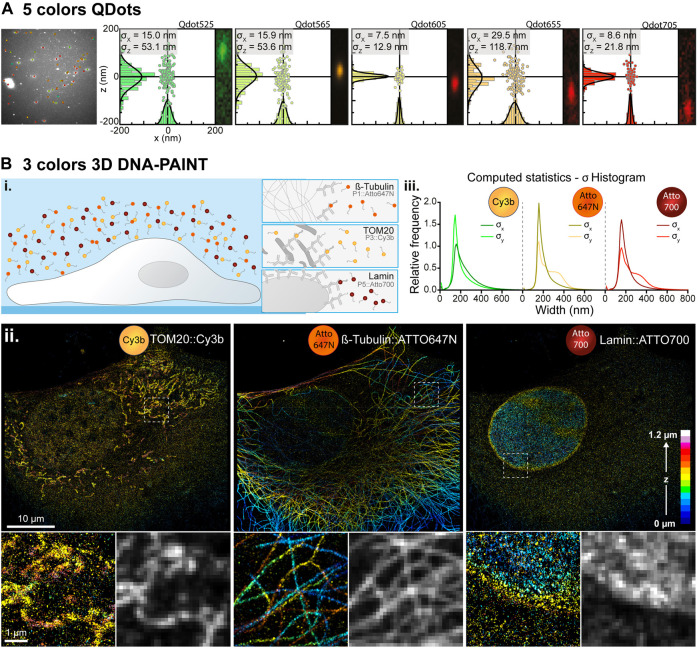
FIGURE 2.
Simultaneous multi-color single molecule detection. (A) Simultaneous detection of five spectrally different Qdots. Left: Image of a field of view containing five spectrally different populations of Qdots with their overlaid localization and emission wavelength determined by spectrally displaced localization. Right: Spectral localizations of Qdots computed from 1,000 consecutive frames for each population of QDots with their localization histogram along the x- and z-axis and the associated Gaussian fitting (black curves) for pointing accuracy estimation. The insets represent the images of those Qdots in the spectral (upper) channel inside the pair search zone. (B) Simultaneous three colors 3D DNA-PAINT imaging. (i.) Experiment principle: Three biological structures of interest (microtubule, TOM20 and LaminB1) are labelled within a COS-7 cell with orthogonal DNA docking strands each associated with an imager strand conjugated to a different fluorescent dye (Atto647N, Cy3b and Atto700 respectively). (ii.) Depth color-coded super-resolved 3D reconstructions of the three structures of interest acquired simultaneously and filtered in wavelength to extract each of the three dyes populations. Intensity images have been reconstructed using the ImageJ ThunderSTORM plugin to create a blur effect according to the single molecule localization precision. The lower panels represent zoomed-in images of the dotted white boxes and their comparison with diffraction-limited images of the same areas reconstructed using a fixed Gaussian blur of 100 nm (resp. 250 nm) standard deviation in XY (resp. Z), to simulate diffraction limited spatial resolutions of 230 nm (resp. 575 nm). (iii.) Histograms of the astigmatism-based PSF widths along the x- ( ) and y-axis ( ) for each dyes’ population computed by bidimensional Gaussian fitting.

