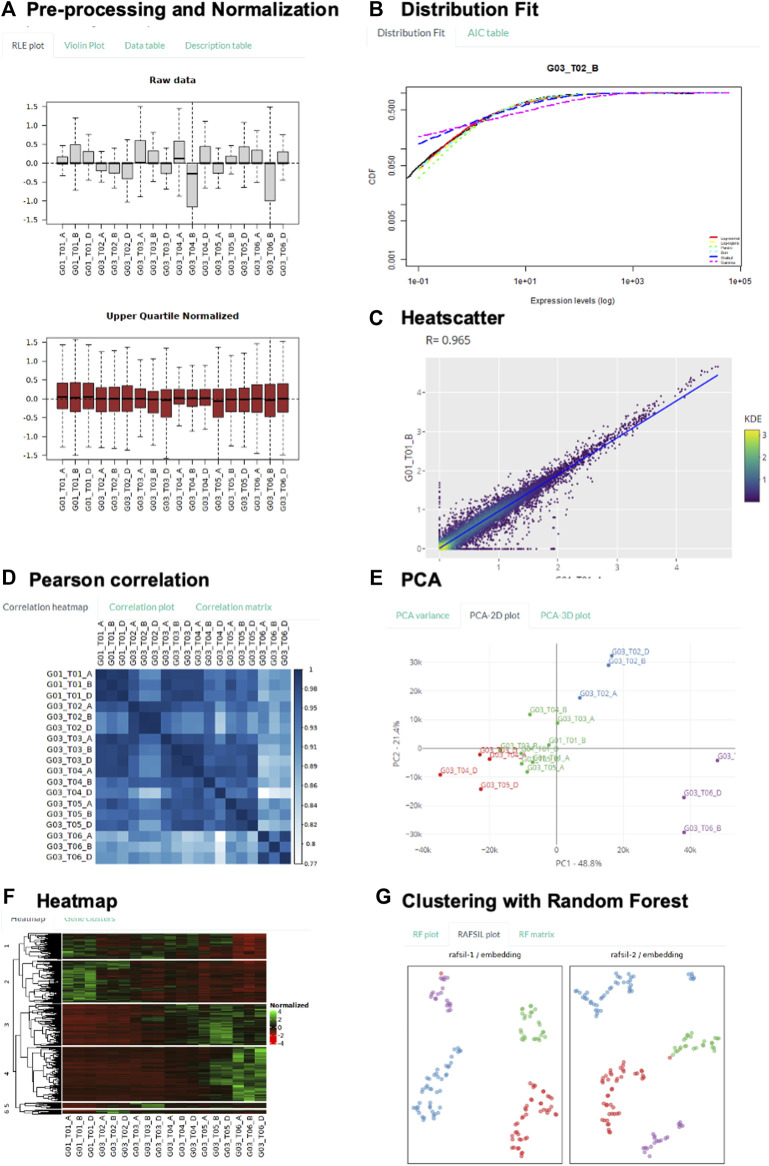
FIGURE 3.
Demonstration of Key Transcriptomic Analysis using GeneCloudOmics. (A–F) using bulk-RNASeq human T-regulatory cell differentiation data, and (G) using single-cell RNASeq mouse distal lung epithelium data. (A): RLE plot of raw and normalized data, showing sample variation reduced after normalization. (B): Comparing transcriptome-wide distribution with six model distributions to select suitable expression cut-off threshold. (C): Between-replicate transcriptome-wide variation visualized by scatter plot. (D): Pairwise Pearson correlation between all samples. (E): Principal component analysis visualizes all sample data points in 2 dimensions. (F): Hierarchical clustering reveals common expression patterns throughout the T cell differentiation process, visualized by heat map of expression level. (G): Random Forest clustering divides single cells according to their developmental stages.

