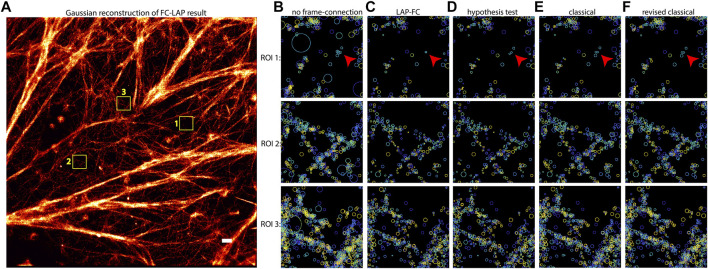
FIGURE 4.
Frame-connection results for actin microfilament localizations generated by multi-emitter fitting. (A) Gaussian reconstruction image of the LAP-FC frame-connection results. Selected ROIs indicated by numbered yellow boxes in (A) are shown for the frame-connection results using (C) LAP-FC with a maximum pre-clustering frame gap of five frames and a maximum separation of 5 times the localization error; (D) the hypothesis test algorithm with a maximum frame gap of five frames, a maximum separation of 1 pixel, and a level-of-significance of 0.05; (E) the classical algorithm with a maximum frame gap of 1 frame and a maximum separation of 0.2 pixels; and (F) the revised classical algorithm with a maximum frame gap of five frames and a maximum separation of 2 times the localization error. Scale bar = 0.5 μm. Localizations in (B)–(F) are displayed as circles of radius equal to the localization error centered on the estimated position and color-coded to indicate time, with dark blue indicating the start of the experiment and yellow indicating the end of the experiment. The red arrows in (B)–(F) ROI 1 point to a qualitatively interesting set of localizations.

