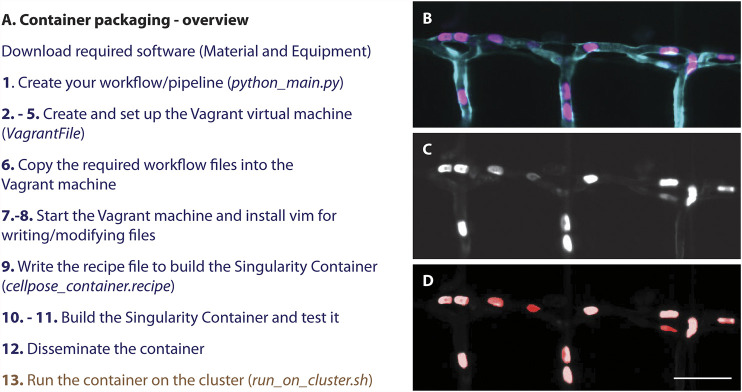
FIGURE 2.
(A) Overview of a step-by-step protocol to establish a Singularity container. While an image analysis specialist of a facility is required to follow all steps (blue), an end user only needs to run the container (brown) and therefore does not have to deal with setting up the software and its dependencies correctly. (B–D) Resulting segmentation from applying the here described container: (B) Still image of red blood cells (magenta) labelled with Tg (Gata1a:dsRed) (Traver et al., 2003) in a zebrafish embryo with a vascular marker (cyan) Tg (kdrl:eGFP) (Jin et al., 2005). (C) Grey scale image of the labelled red blood cells (D) Resulting segmentation (red) overlayed on the grey scale image (C). Scalebar: 50 um.

