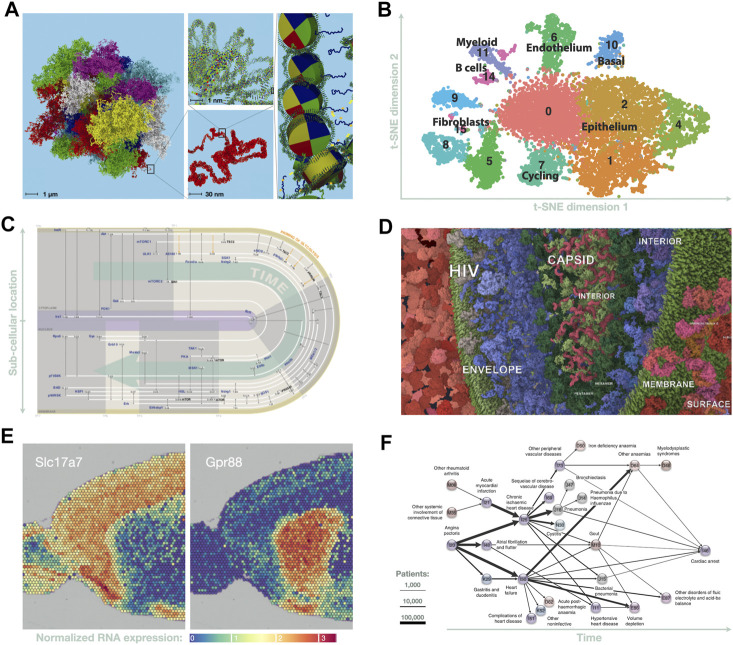
FIGURE 2.
Six data visualization methods currently used in bioinformatics grand challenges. (A) A molecular-scale, 3D model of the human genome may soon be feasible; in preparation, visualization tools are being developed to enable interactive, multiscale exploration of such models (adapted from Asbury et al. (2010)). (B) t-SNE analysis of scRNA-seq data on breast cancer metastasis (adapted from Valdes-Mora et al. (2019)). (C) Spatiotemporal graph of phosphorylation events in fat cells following insulin stimulation (adapted from Ma et al. (2015), by Jenny Vuong). (D) Here, an interactive, web-based data integration environment is used to explore and curate a molecular-scale model of a subcellular landscape showing HIV-host interactions (Klein et al., 2018; Autin et al., 2020). (E) Portion of spatial transcriptomics analysis showing expression of two genes in an anterior slice from mouse brain (adapted from Vandenbon and Diez (2020)). (F) Disease trajectory graph showing progression from heart pain to cardiac arrest across the entire Danish population (adapted from Jensen et al. (2014)).

