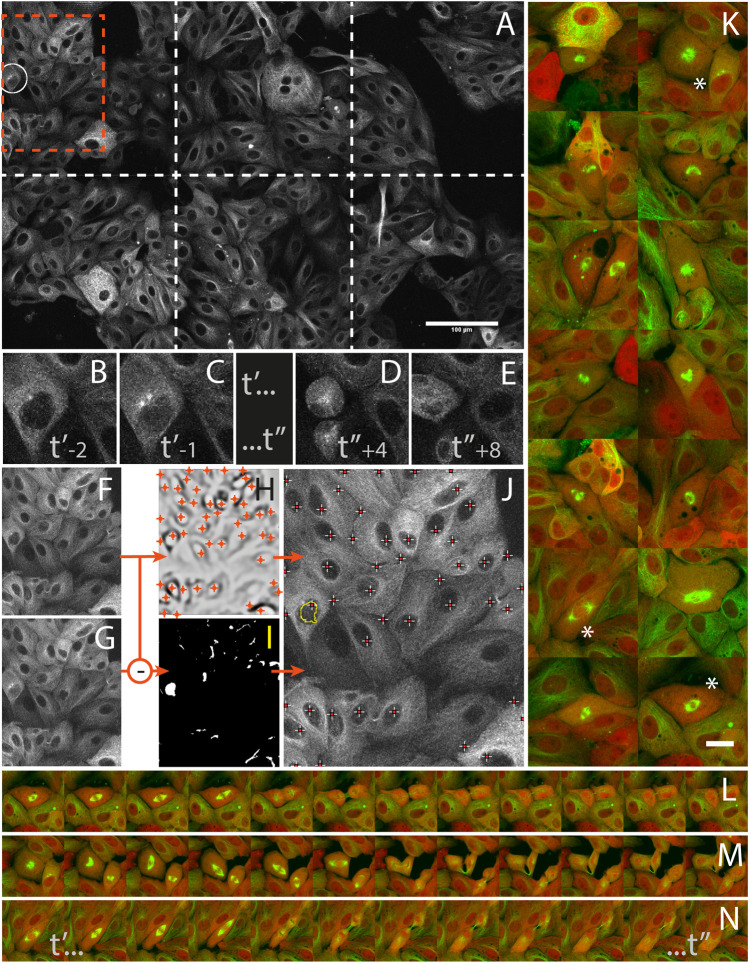
FIGURE 5.
Capturing mitosis events from their onsets with AutoScanJ (LLC-PK cells, α-tubulin, confocal fluorescence microscopy). (A) A frame (at time t’-1) of the 3x2 tiled primary scan map showing a positive event at the onset of a mitosis is detected (white circle). (B,C) time sequence of the detected mitotic cell before switching to secondary scan: t’ and t’’ are start- and end-time points of secondary scan, indices are frame numbers. (D,E) The same cell after mitosis in the next primary scan. (F–J)] Associated image analysis workflow (cropped region from orange box in A] including the mitotic cell). Frame t’-2 (F) is subtracted to frame t’-1 (G), and the result is median-filtered and thresholded (I). Particles resembling a nucleus in size and shape (see the largest particle in I) are added to a pool of candidates, and validated as “detected mitosis” if a nucleus was detected inside (see crosses in J) in frame t−2. Nuclei are detected as local intensity minima from frame t-2 LoG filtered image (H, shown with inverted contrast), and reported as white/red crosses in final image (J). K] A montage of secondary scan images from 14 mitotic cells (green: α-tubulin, red: Centrin) detected during a 16 h long experiment. The same first time frame at t’ is represented for all mitoses. (L–N) Three selected time lapse sequences of the secondary scan from t’ to t’, acquired every 5 min. All images shown are z-stacks maximum intensity projections. Scale bars: A - 100 µm, K - 20 µm.

