
FIGURE 2.
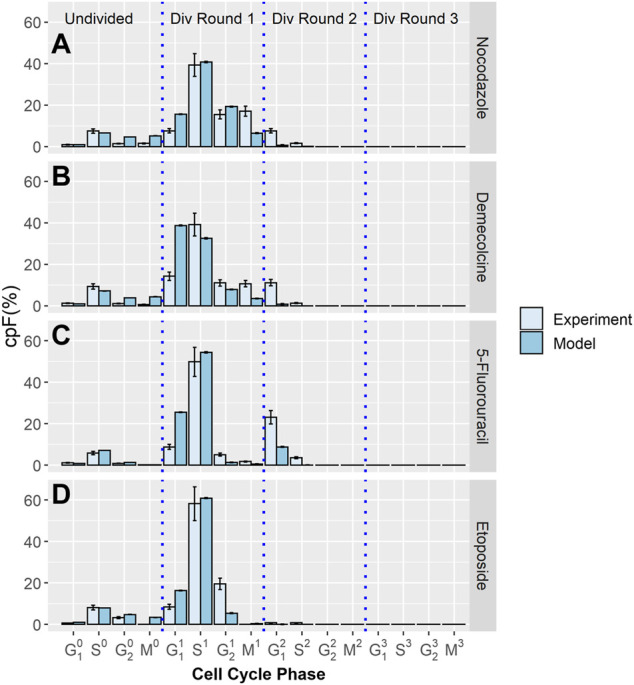
Experimental and model cpF results for cell populations treated with different inhibitor drugs. Experimental (light blue bars) and model (dark blue bars) cpFs after 48 h, after introducing therapeutics; (A) Nocodazole (B) Demecolcine (C) 5-Fluorouracil (D) Etoposide at 32 h. Error bars on experimental data show the largest percentage error for any population observed in the control data. Error bars on model data show standard error from fits of 100 in-silico cell populations.