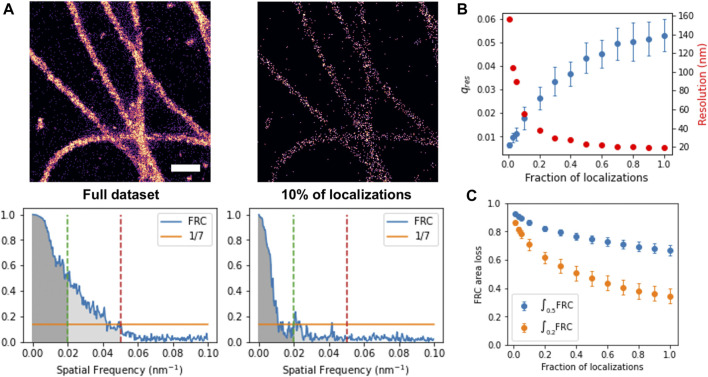
FIGURE 2.
Fourier Ring Correlation to estimate image improvement with increasing density of localizations. (A) Histogram rendering (top) and corresponding FRC (bottom) of full and sparse set of localizations, with threshold 1/7 and area threshold 0.2 (green) and 0.5 (red) indicated. Scale bar: 300 nm, (B) FRC cutoff frequency (blue) and corresponding resolution (red) as function of the fraction of total localizations, (C) FRC area loss for a threshold of 0.2 (yellow) and 0.5 (blue) as function of the fraction of total localizations.

