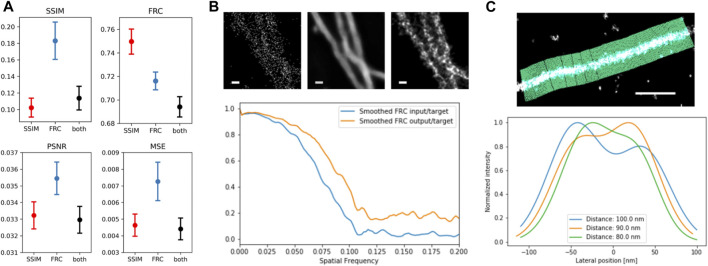
FIGURE 4.
Evaluation of trained networks. (A) averaged MS-SIM and FRC (top), as well as peak signal-to-noise ratio (PSNR) and mean squared error (MSE) for 20 network output and target images from the validation dataset; error bars denote SEM. (B) FRC improvement as function of spatial frequency of input (left) vs. target (right) and output (center) vs. target. Scale bar = 100 nm. (C) Line Profiler evaluation illustrated at the top and applied to two adjacent simulated filaments with distance of 80 nm (green), 90 nm (yellow) and 100 nm (blue), showing the emergence of two separate peaks.

