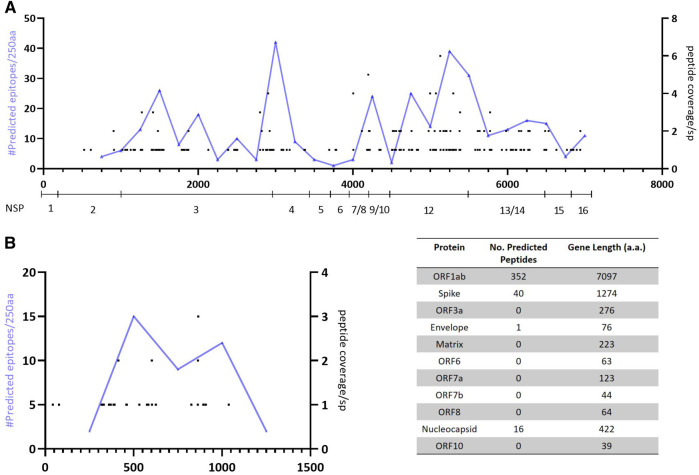
FIGURE 3.
Mapping of predicted epitopes with 100% conservation showing location and number of predicted responses across the proteome and cumulative number of precited epitopes per 250aa. (A)—Predicted responses mapped across the ORF1ab polyprotein (with NSP genes identified). (B)—Predicted responses mapped across the spike glycoprotein.

