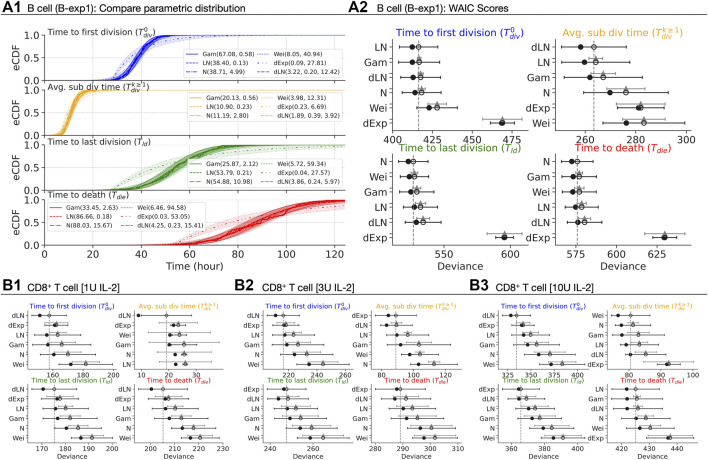
FIGURE 4.
Best parametric distribution class. (A1) Empirical CDF of the measured times are overlaid with CDFs of Gamma, Lognormal, Normal, Weibull, delayed Exponential and delayed Lognormal distributions. 95% confidence bands are plotted by randomly drawing 104 samples from respective posterior distributions. (A2, B1–B3) The in-sample deviance (dot), and WAIC scores (open-circle) with 1 standard deviation error bar are shown. The y-axis is sorted from lowest (top) to highest (bottom) WAIC score. The lower WAIC score indicates better descriptor of the data. Except the top-ranked one, the value of the difference of WAIC (grey triangle) between a candidate and the top-ranked are shown with 1 standard error of the difference.

