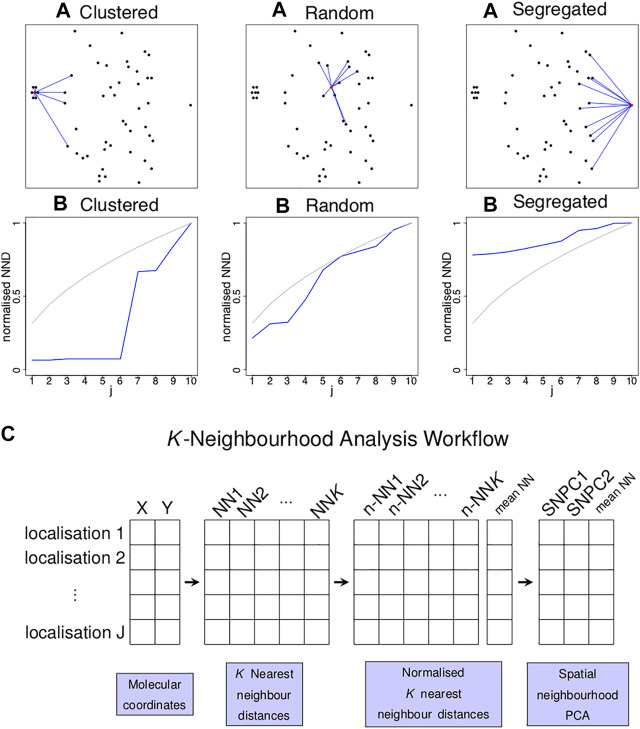
FIGURE 1.
Concept of k nearest neighbour distances to identify localised spatial organisations for each point in an image. (A) Three examples of a single point (highlighted in red) residing in a cluster of six points (left), random point distribution (middle) and segregated from other points (left) and its K = 10 nearest neighbours (blue lines). (B) Plots of the normalised distance from the red localisation to the jth nearest neighbour (y-axis) against j (x-axis) for the examples above (blue lines) and for completely spatially random (CSR) data (grey lines). Each of the three scenarios shown in (A) gives rise to a characteristic curve in (B). (C) Schematic diagram illustrating the workflow of the K-Neighbourhood Analysis.

