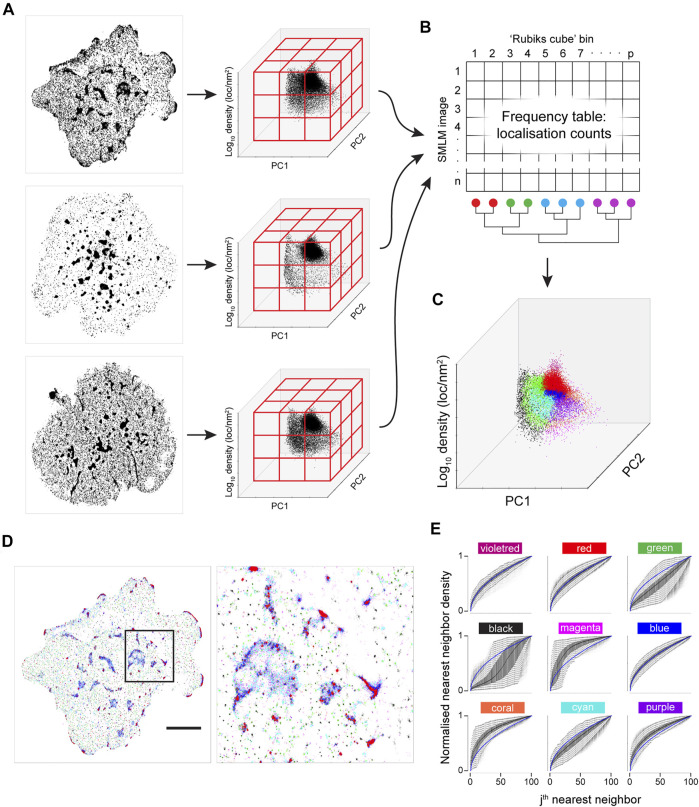
FIGURE 5.
Joint K-neighbourhood analysis over a set of diverse SMLM images. SMLM data are from ILA TCR, first gen CAR and second gen CAR in Jurkat cells activated on supported lipid bilayers containing ICAM-1 and pMHC or CAR ligands. (A) Each image is converted into topological coordinates, and the ensuing cloud of points is discretised using a 50 × 50 × 50 grid that is common to all images. Example images of TCR (top panel), first gen CAR (middle panel) and second gen CAR (bottom panel) are shown. (B) The number of localisations in each bin is counted and the grid is unfolded to yield a count vector. The count vector forms a frequency table, where each image is now represented by a row of the frequency table. The bins (columns) are clustered to give localisation groups that have a similar frequency profiles across all images. (C) The colour key derived in (B) is transferred to the topological coordinate system. (D). The colour key is transferred back to the SMLM image. Scale bar = 5 μm. (E) Density-normalized nearest neighbour distances (NND) from the entire dataset for the first K = 100 neighbouring localisations for each of the nine spatial organisations arranged in the pattern of the 2-D plot in a. identifies differences in local topology. Colour key as in (C).

