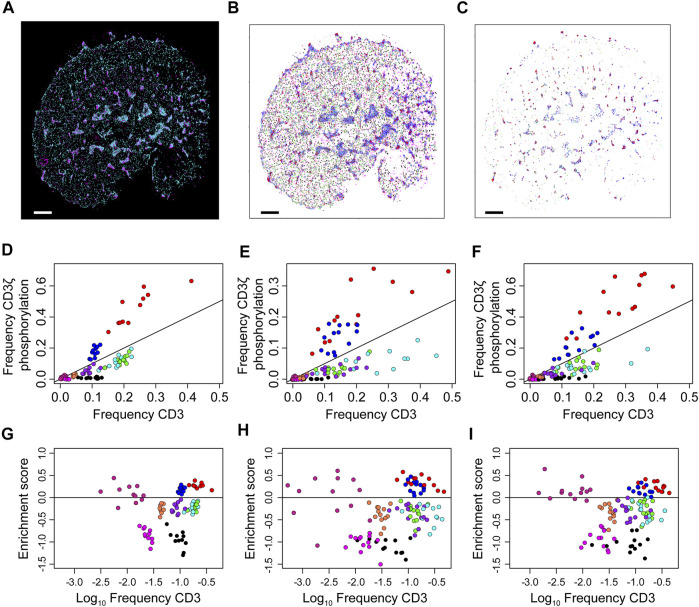
FIGURE 7.
Over- and under-representation of CD3ζ phosphorylation for each of nine co-existing spatial organisations in cells expressing TCR, first generation CAR or second generation CAR. (A) Two-colour SMLM images of CD3ζ (cyan) and phosphorylated CD3ζ (pCD3ζ, magenta) of the TCR-CD3 complex in a Jurkat ILA cell activated on a pMHC-decorated bilayer. (B) SMLM images of CD3ζ with localisation colour-coded according to the nine spatial groups. (C) SMLM images of CD3ζ that are within 10 nm of pCD3ζ localisations. The frequency of these CD3ζ localisations are plotted in (D–F). Colour key as in (B). In (A–C), scales bar = 2.5 μm (D–F). Frequency of CD3ζ phosphorylation as a function of the percentage of total CD3ζ localisations among the nine spatial organisations for TCR (D), first generation CAR (E) and second generation CAR (F). Each symbol represents one spatial group from one SMLM image. The black line indicates no preference in phosphorylation; groups above the line are preferably phosphorylated, groups below the line are under-represented in CD3ζ phosphorylation. Note the similarity between the three receptor types. (G–I) Phosphorylation enrichment score as a function of CD3ζ occupancy in the nine spatial organisations for TCR (G), first generation CAR (H) and second generation CAR (I). Each symbol represents one spatial group from one SMLM image. Symbols above the black horizontal line represent spatial groups that are over-represented in CD3ζ phosphorylation; symbols below the black line represent spatial groups that are under-represented in CD3ζ phosphorylation. The phosphorylation patterns are not significantly different over the three experimental groups (Methods).

