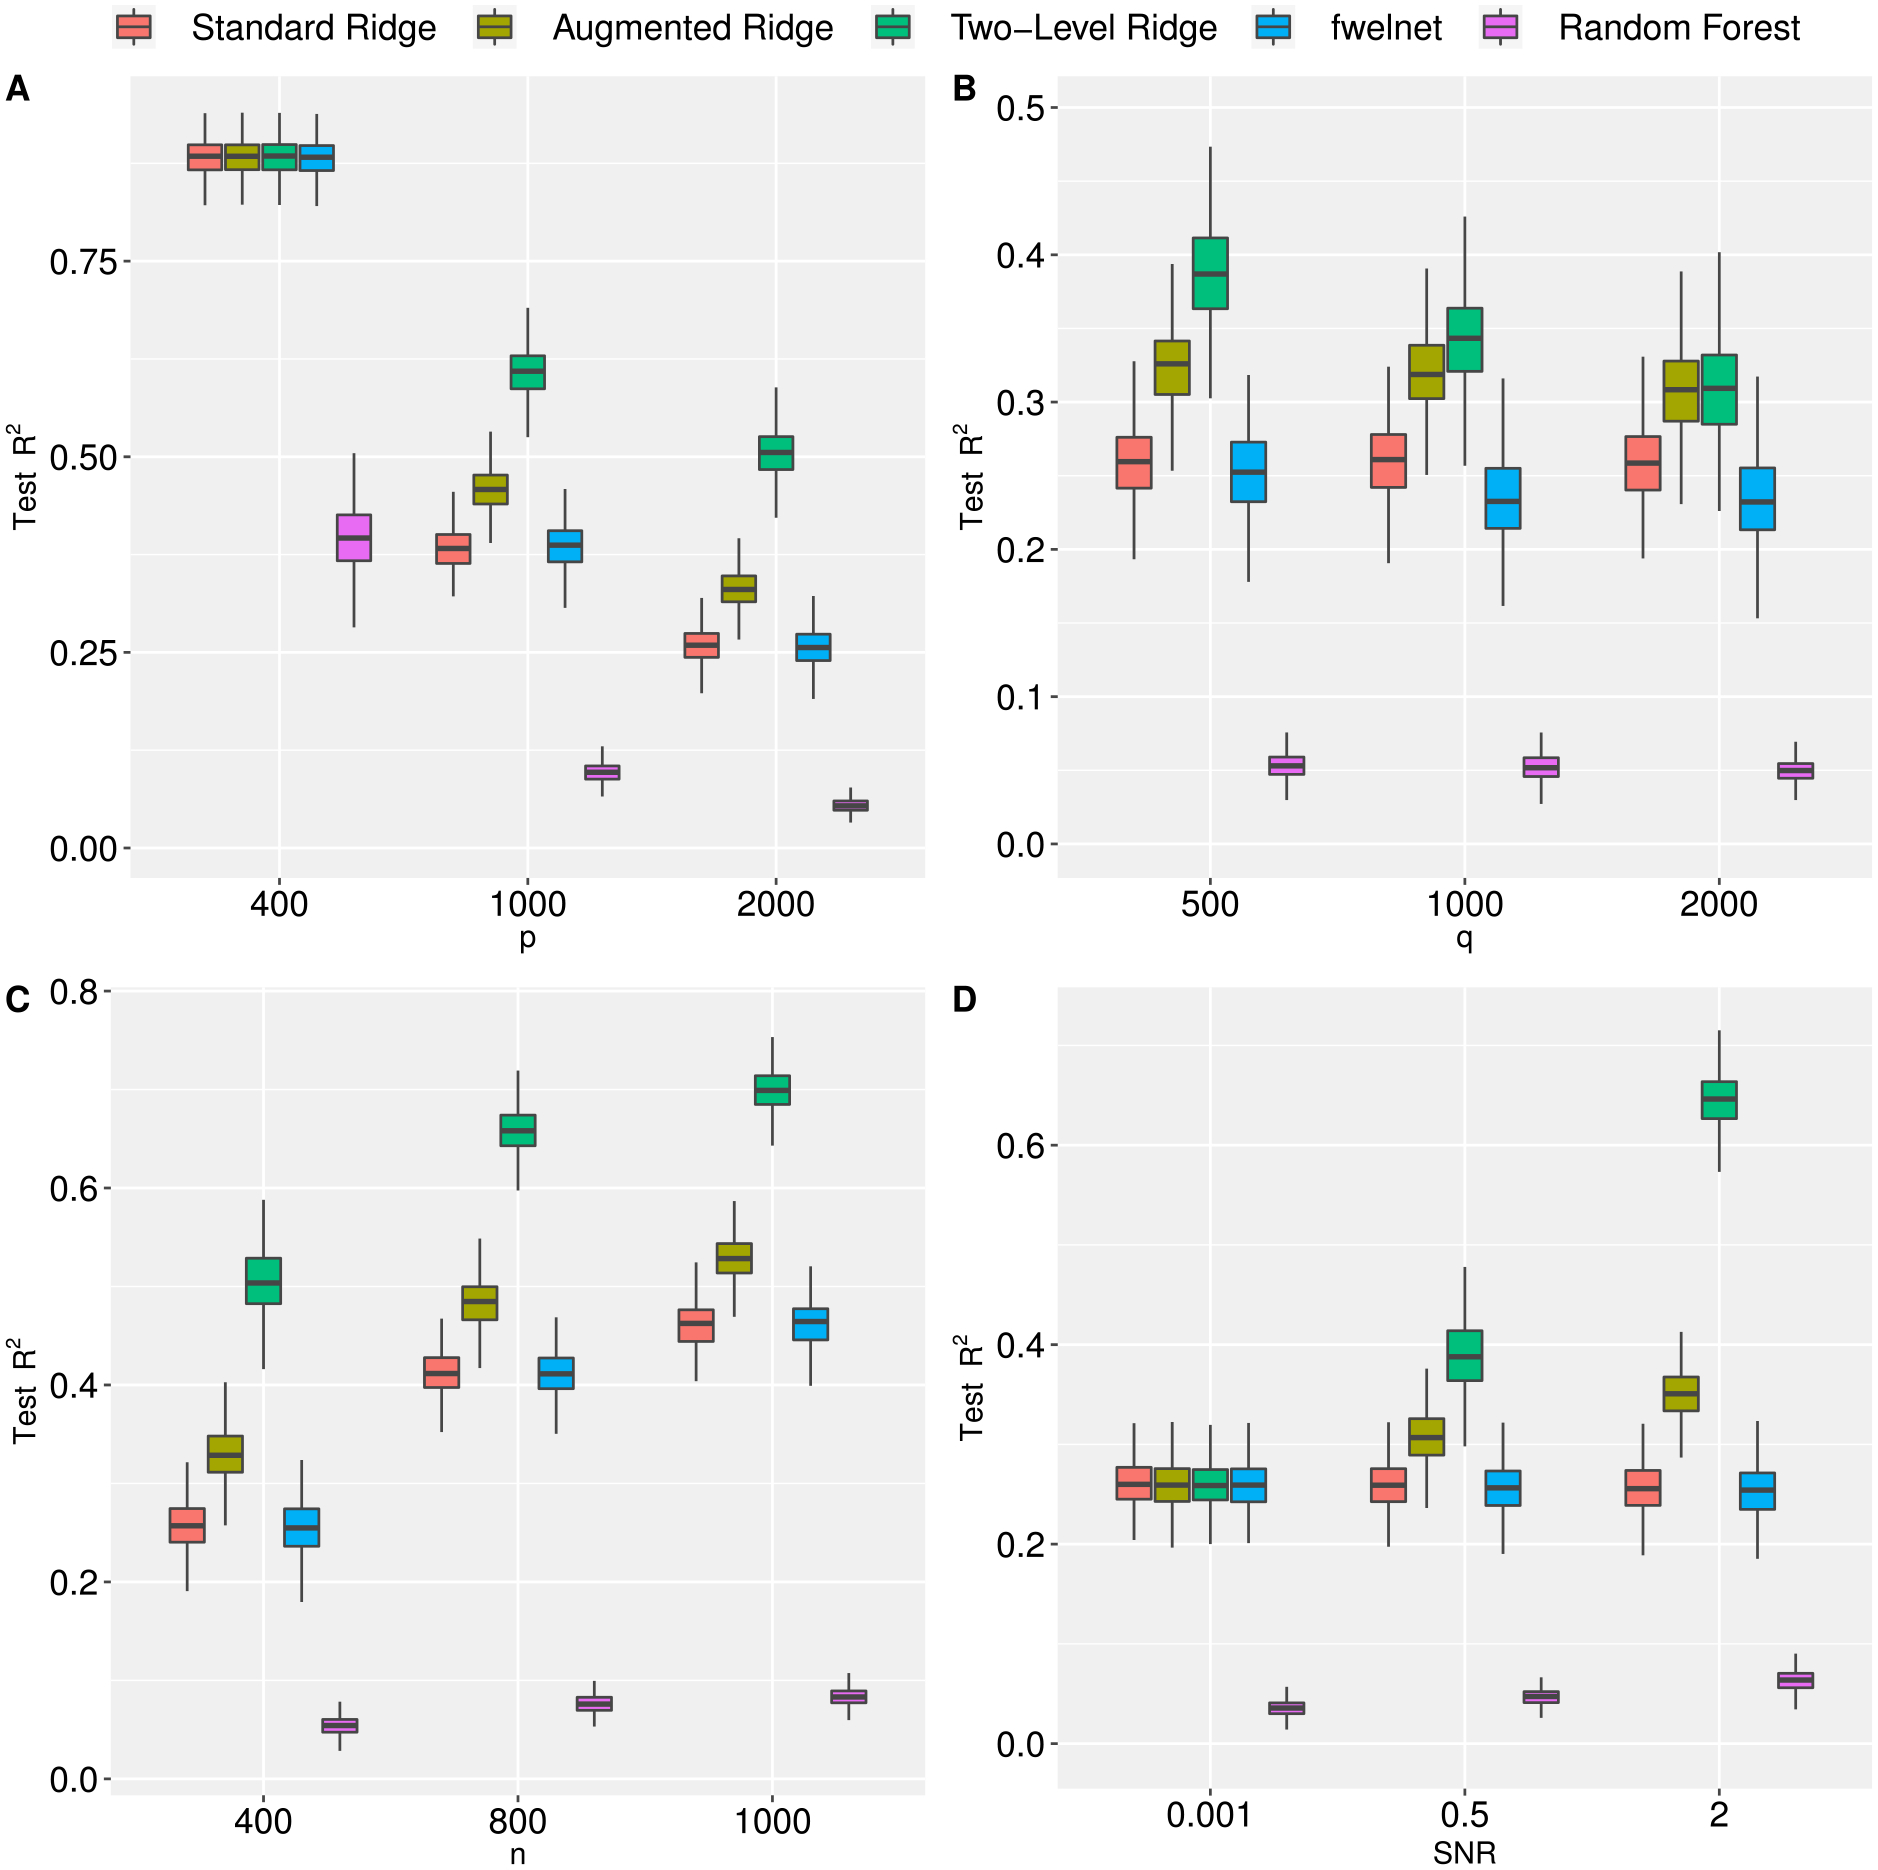
Figure 2:

Prediction performance, as measured by test R2, of standard, augmented, and two-level ridge regression, feature-weighted elastic net (ridge), and random forest by number of features (Panel A), number of meta features (Panel B), sample size (Panel C), and signal-to-noise ratio (Panel D). In Panel A we fix n = 400, q = 150 and SNR = 1. In Panel B we fix p = 2,000, n = 400, and SNR = 1. In Panel C we fix p = 2,000, SNR = 1 and q = 150. In Panel D we fix p = 2,000, q = 150, and n = 400. Results are averaged over 500 Monte Carlo replications. (See Section 3.2 for more information).
