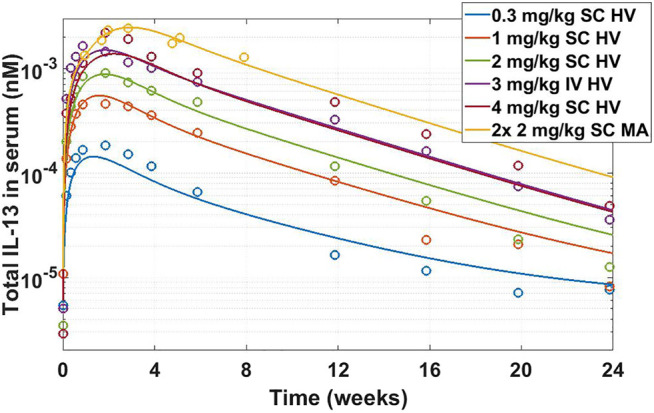
FIGURE 8.

Total IL-13 accumulation after IMA-026 administration in Phase I trial - model simulations vs published data. Different color solid lines correspond to different doses, open circles with corresponding colors are clinical data. Labels: SC, subcutaneous; IV, intravenous; HV, healthy volunteers; MA, mild asthmatics. The model reasonably captures the behavior using internal affinity measures, previously published target data, and published PK parameters for IMA-026, without fitting any parameters.
