
FIGURE 3.
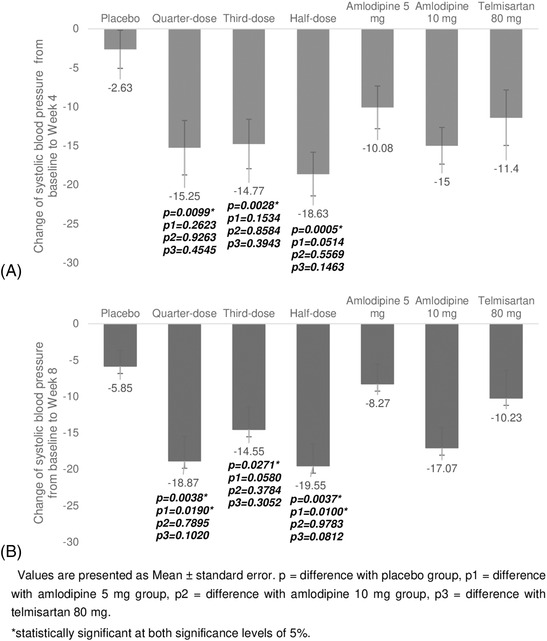
Changes in systolic blood pressure (BP) from baseline to Week 4 (A) and Week 8 (B). Values are presented as the mean ± standard error. p = difference with the placebo group, p1 = difference with the amlodipine 5 mg group, p2 = difference with the amlodipine 10 mg group, p3 = difference with the telmisartan 80 mg. *Significant at the 5% level