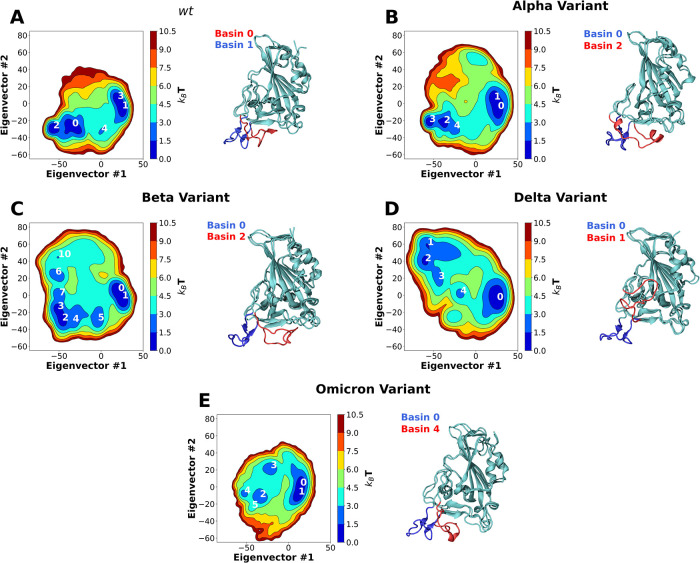
Figure 2.
Two-dimension principal component analysis (PCA) of SARS-CoV-2 RBD conformational dynamics in water. Plots of the first two principal components determined from the Cα backbone of the wt RBD (A) as well as the Alpha (B), Beta (C), Delta (D) and Omicron (E) variants. Basins with kBT < 3 are numbered in each figure. Snapshots of the lowest energy structures for selected open and closed basins are also shown. The ridge regions of the open and closed snapshots are colored in blue and red, respectively.

