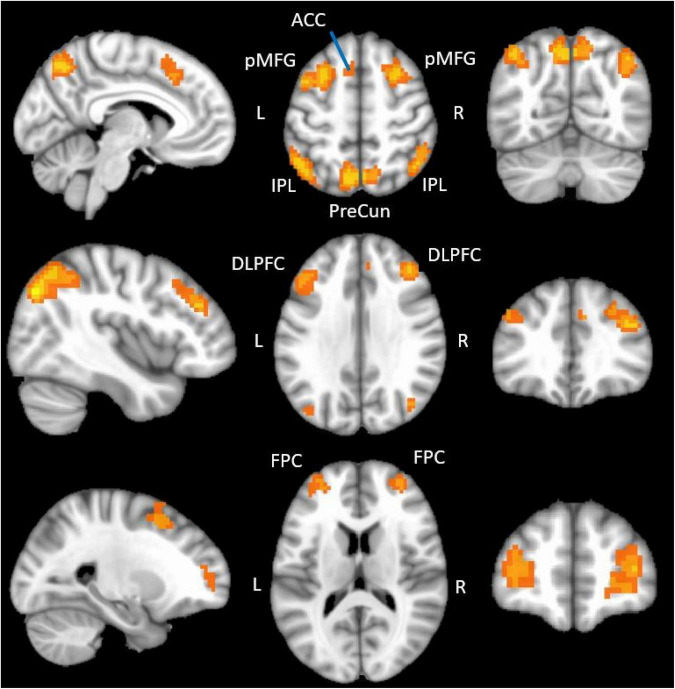
FIGURE 1.
fMRI regions showing functional activation during the N-back tasks. The figure displays the positive functional activation using a group level functional contrast [(2-back/2 + 1-back/2) > Compare] overlaid onto a 1 mm MNI ICBM152 template (MNI ICBM152 1 mm 6th generation atlas; Grabner et al., 2006). fMRI data were thresholded (q = 1 × 10– 10) and clusterized (minimum cluster size = 20) in this figure to optimize display. ACC, anterior cingulate; pMFG, posterior middle frontal gyrus; IPL, inferior parietal lobule; PreCun, precuneus; DLPFC, dorsolateral prefrontal cortex; FPC, frontopolar cortex.

