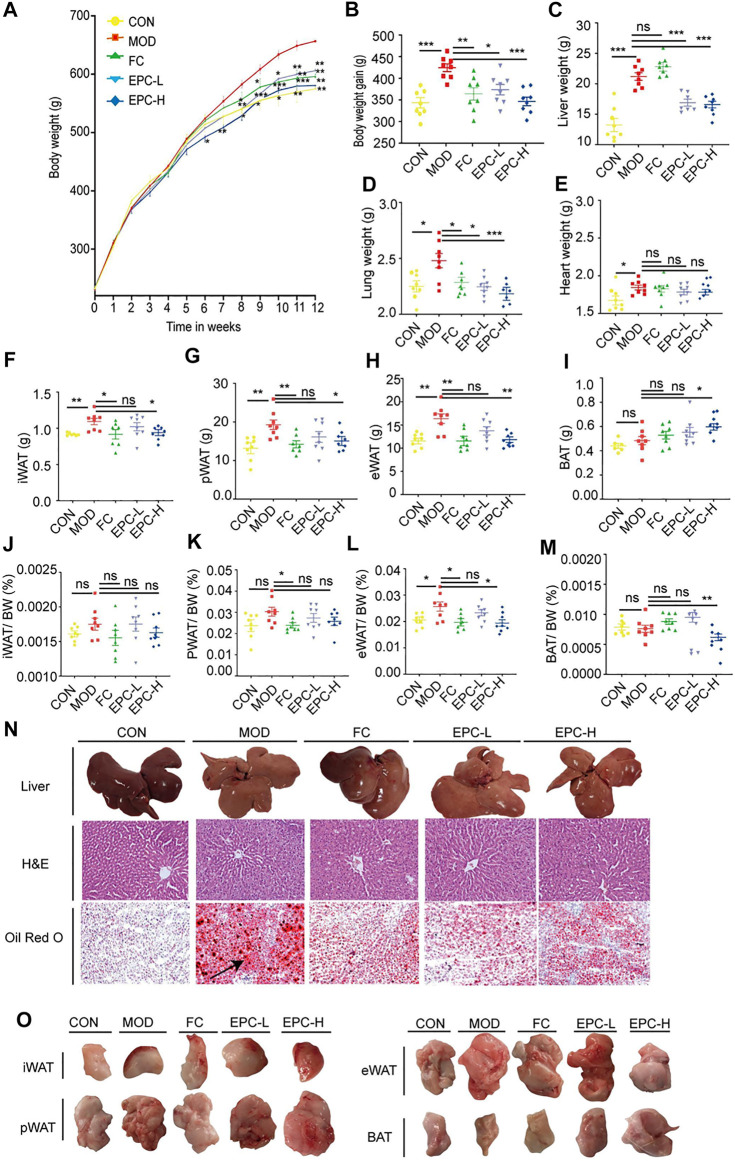
FIGURE 2.
EPC ameliorated MAFLD in rats. (A) Body weight (BW). (B) BW gain. (C–E) Organ wet weight. (F) Inguinal white adipose tissue (iWAT). (G) Perirenal white adipose tissue (pWAT). (H) Epididymis white adipose tissue (eWAT). (I) Brown adipose tissue (BAT). (J) iWAT/BW ratio. (K) pWAT/BW ratio; (L) eWAT/BW rati. (M) BAT/BW ratio. (N) Representative rat liver images of hematoxylin and eosin (H, E) and Oil Red Ostaining per group (X200). (O) Representative iWAT, pWAT, eWAT, BAT. One-way analysis of variance (ANOVA) was conducted for the group comparison. n = 8, data are presented as mean ± SEM. *p < 0.05, **p < 0.01, ***p < 0.001 vs. MOD group. EPC, P. cocos ethanol extract; CON, normal diet control group; MOD, high-fat diet group; FC, Fenofibrate capsules; EPC-L, low-dose P. cocos ethanol extract; EPC-H, high-dose P. cocos ethanol extract.

