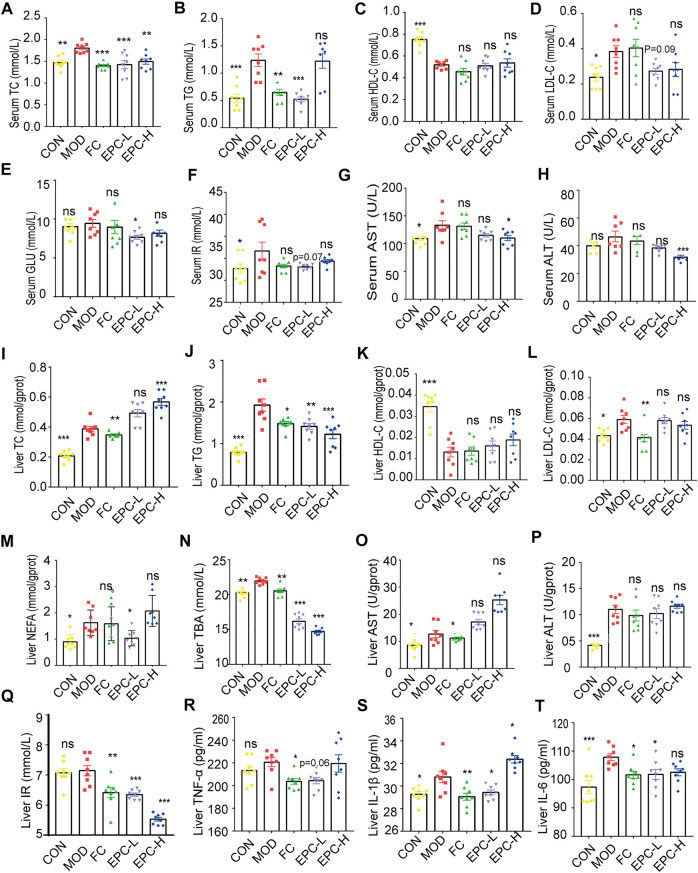
FIGURE 3.
EPC administration improved lipid metabolism in HFD-fed rats. (A–H) Serum concentrations of TC, TG, HDL, LDL, GLU, IR, AST, and ALT in the rat. (I–T) Liver concentrations of TC, TG, HDL, LDL, NEFA, TBA, AST, ALT, IR, TNF-α, IL-1β, and IL-6. One-way analysis of variance (ANOVA) was conducted for the group comparison. n = 8, data are presented as mean ± SEM. *p < 0.05, **p < 0.01, ***p < 0.001 vs MOD group. TC, cholesterol; TG, triglyceride; BA, bile acid; TBA, total bile acid; NEFA, nonesterified free fatty acids; ALT, alanine transaminase; AST, aspartate transaminase; NEFA, nonesterified free fatty acid; LDL-C, low-density lipoprotein cholesterol; HDL-C, high-density lipoprotein cholesterol; TNF-α, tumor necrosis factor-α; IL-1β, Interleukin -1β; IL-6, Interleukin -6; IR, Insulin Receptor; GLU, glucose.

