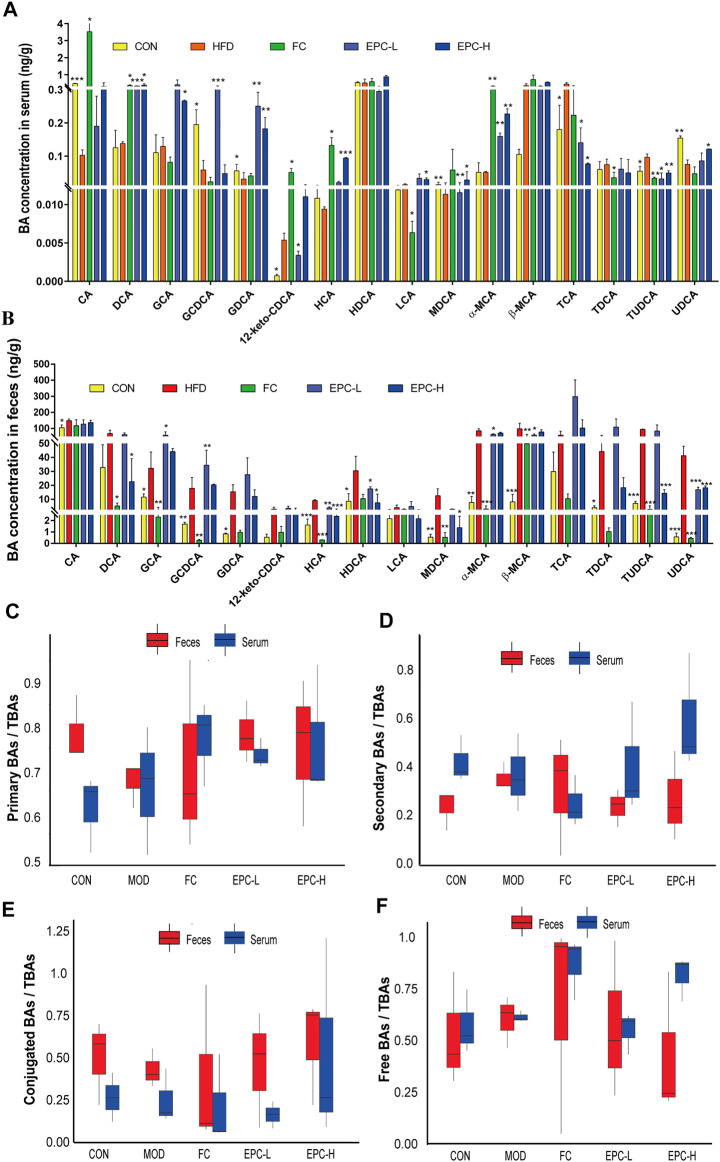
FIGURE 4.
Effect of EPC on bile acid profiles in serum and feces. (A) BAs concentration in serum. (B) BAs concentration in feces. (C) Serum and fecal primary BAs concentration/serum and fecal TBAs concentration box chart. (D) Serum and fecal secondary BAs concentration/serum and fecal BAs concentration box chart. (E) Serum and fecal concentrations of conjugated BAs/serum and fecal TBAs concentrations box chart. (F) Free BAs concentration in serum and feces/serum and fecal BAs concentration box chart. n = 3, data are presented as mean ± SEM. CA, 12-keto-CDCA, HDCA, MDCA, and TCA in serum and GDCA, MDCA, HDCA, TDCA in feces by Tukey’s post hoc test. The rest of the data were tested using paired Student‘s t-tests. *p < 0.05, **p < 0.01, ***p < 0.001 vs MOD group. CA, cholic acid; GCDCA, glycine (G)-chenodeoxycholic acid; GDCA, G-deoxycholic acid; MDCA, murideoxycholic acid; UDCA, ursodeoxycholic acid; TUDCA, taurine (T)-UDCA; HCA, hyocholic acid; HDCA, hyodeoxycholic acid.

