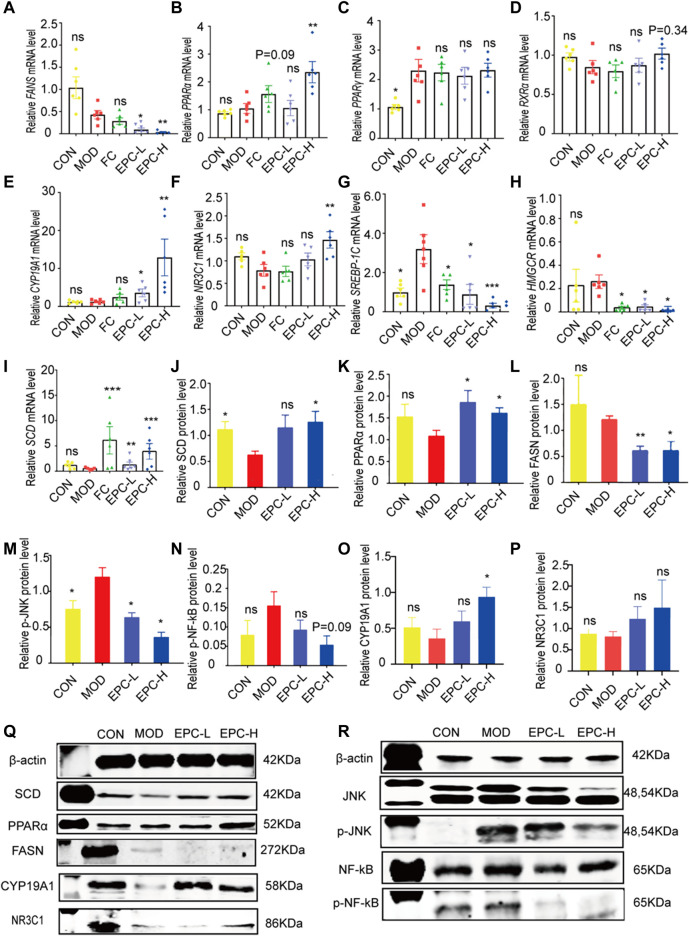
FIGURE 5.
EPC regulated the lipid metabolism-related genes and proteins inMAFLD rats. (A) mRNA abundances of FASN. (B) mRNA abundances of PPARα (PPARΑ). (C) mRNA abundances of PPARγ (PPARG). (D) mRNA abundances of RXRα. (E) mRNA abundances of CYP19A1. (F) mRNA abundances of NR3C1. (G) mRNA abundances of SREBP-1c. (H) mRNA abundances of HMGCR. (I) mRNA abundances of SCD. n = 6; (J) Relative expression of protein SCD. (K) Relative expression of protein PPARα. (L) Relative expression of protein FASN. (M) Relative expression of protein p-JNK. (N) Relative expression of protein p-NF-κB. (O) Relative expression of protein CYP19A1. (P) Relative expression of protein NR3C1. (Q-R) Representative immunoblotting images of β-actin, SCD, PPARα, FASN,CYP19A1, NR3C1, JNK, p-JNK, NF-κB, pNF-κB; n = 4, data are presented as mean ± SEM. One-way analysis of variance (ANOVA) was conducted for the group comparison. *p < 0.05, **p < 0.01, ***p < 0.001 vs MOD group. FASN, fatty acid synthase; PPARα/γ, peroxisome proliferator-activated receptor alpha/gamma; RXRa, retinoic acid receptor alpha; SREBP-1c, sterol regulatory element binding protein 1c; HMGCR, 3-hydroxy-3-methylglutaryl-coenzyme A reductase; SCD, Stearoyl-CoA desaturase; p-JNK, phosphorylation (p) -stress-activated protein kinase JNK; NF-κB, nuclear factor kappa B.

