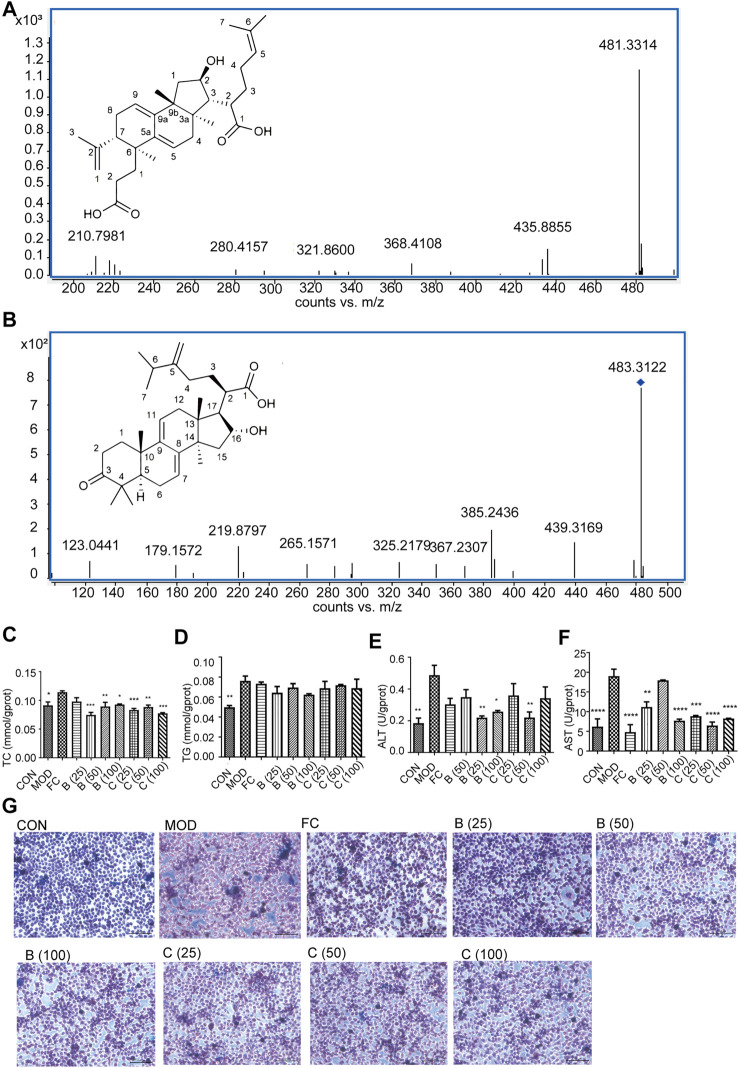
FIGURE 8.
Identification of poricoic acid B and polyporenic acid C. (A) Characteristic ion peak and 2D structure of poricoic acid B. (B) Characteristic ion peak and 2D structure of polyporenic acid C. (C‐F) Cell levels of TC, TG, ALT, AST. (G) Fat accumulation in cells were evaluated under a light microscope (×200) after Oil Red O staining dose (25, 50, and 100 μmol/L) of poricoic acid B group (B (25), B (50), and B (100)), dose (25, 50, and 100 μmol/L) of polyporenic acid C group (C (25), B (50), and B (100)), and FC (150 μmol/L) or separate medium (CON group). n = 3, data are presented as mean ± SEM. One-way analysis of variance (ANOVA) was conducted for the group comparison. *p < 0.05, **p < 0.01, ***p < 0.001, ****p < 0.0001 vs MOD).

