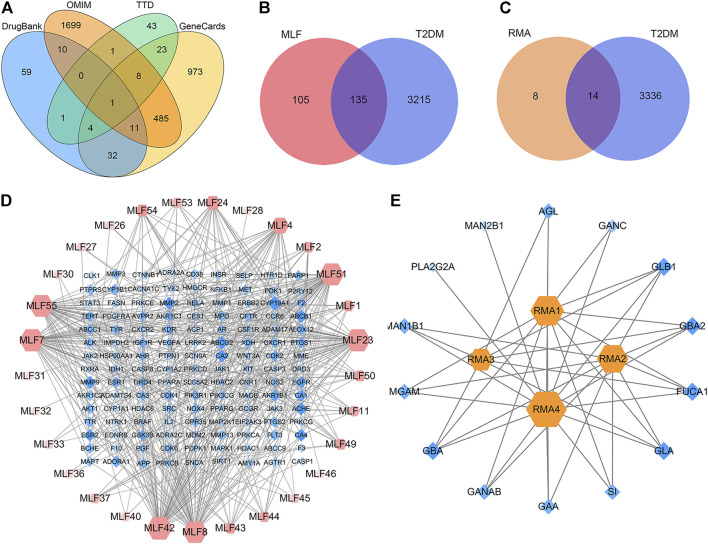
FIGURE 5.
Target or active compound prediction and network construction. (A) Putative targets for T2DM were retrieved from the Drugbank, OMIM, TTD and GeneCards databases. (B) The 135 matched targets common between the predicted mulberry leaf flavonoid targets and the type 2 diabetes targets. (C) The 14 matched targets common between the predicted Ramulus Mori alkaloid targets and the type 2 diabetes targets. (D) The compound-target network implicated in type 2 diabetes using mulberry leaf flavonoids. The red nodes represent the active mulberry leaf flavonoids, whereas the blue nodes represent the antidiabetic targets of the active compounds. (E) The compound-target network implicated in type 2 diabetes using the Ramulus Mori alkaloids. The orange nodes represent the active Ramulus Mori alkaloids, whereas the blue nodes represent the antidiabetic targets of the active compounds. The edges represent the interactions between compounds and targets, and the node size is proportional to the degree of interaction.

