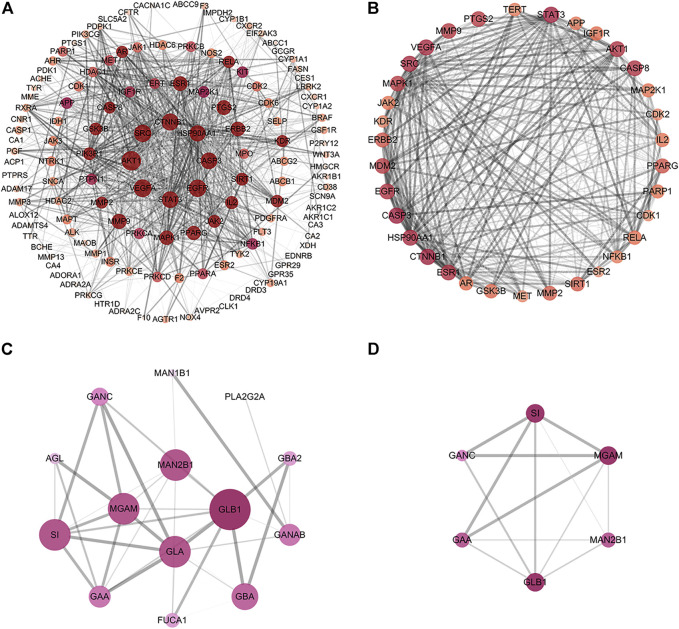
FIGURE 6.
Construction of the PPI network and core targets. (A) The PPI network of potential protein targets of MLF in the treatment of T2DM constructed using Cytoscape and analyzed using NetworkAnalyzer. (B) MCODE cluster generated from (A). (C) PPI network of potential targets of RMA in the treatment of T2DM. (D) MCODE cluster generated from (C). The depth of color represents the degree value, and the node size is proportional to the degree of interaction.

