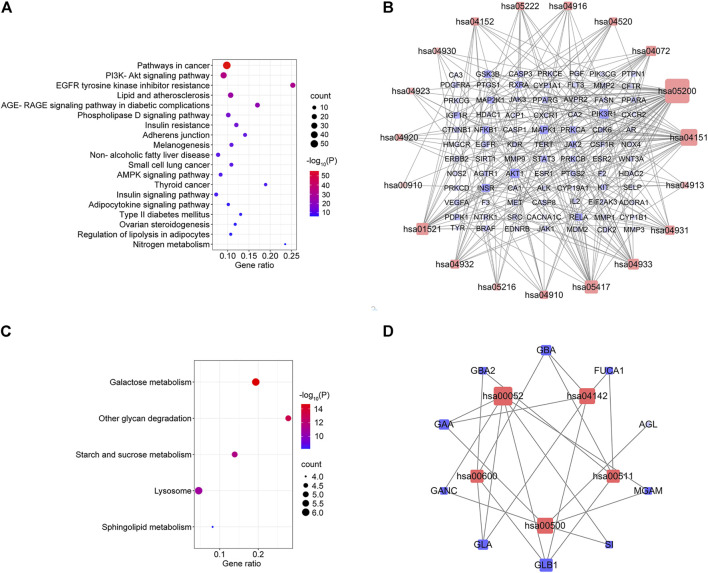
FIGURE 8.
KEGG pathway enrichment analysis of the anti-diabetes targets of MLF and RMA. (A) Pathway enrichment results of MLF at p < 0.01. (B) The target–pathway network implicated in the mechanism of MLF in type 2 diabetes treatment. (C) Pathway enrichment results of RMA at p < 0.01. (D) The target–pathway network implicated in the mechanism of RMA in type 2 diabetes treatment. The red nodes represent the pathways, whereas the blue nodes represent the targets involved in these pathways. The edges represent the interactions between the targets and the pathways, and the node size is proportional to the degree of interaction.

