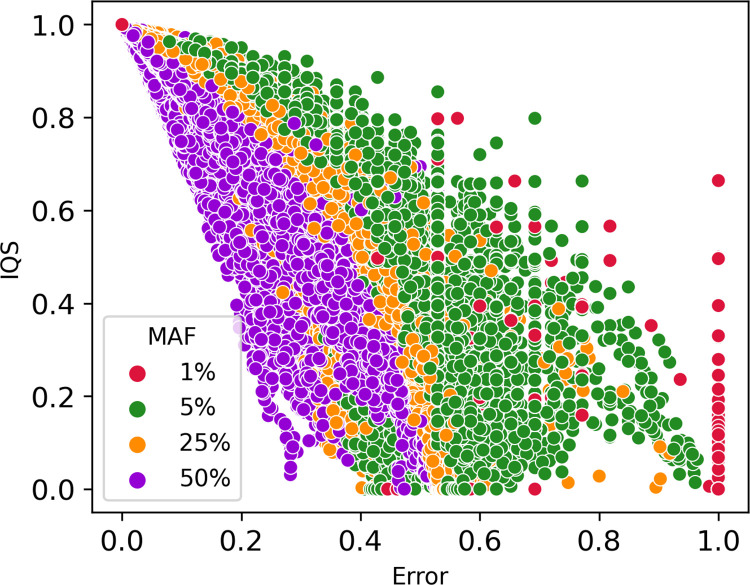
Fig 11. Minor allele frequency (MAF) stratification of imputed variants.
Dots are clustered following minor allele frequency stratification. The dots clustered in the right-down corner of the figure have low IQS and high error rate, while dots in the left-high corner have high IQS and low error rate. Each dot represents the average IQS and error rate for a specific marker imputed with one phasing tool-imputation tool combination.

