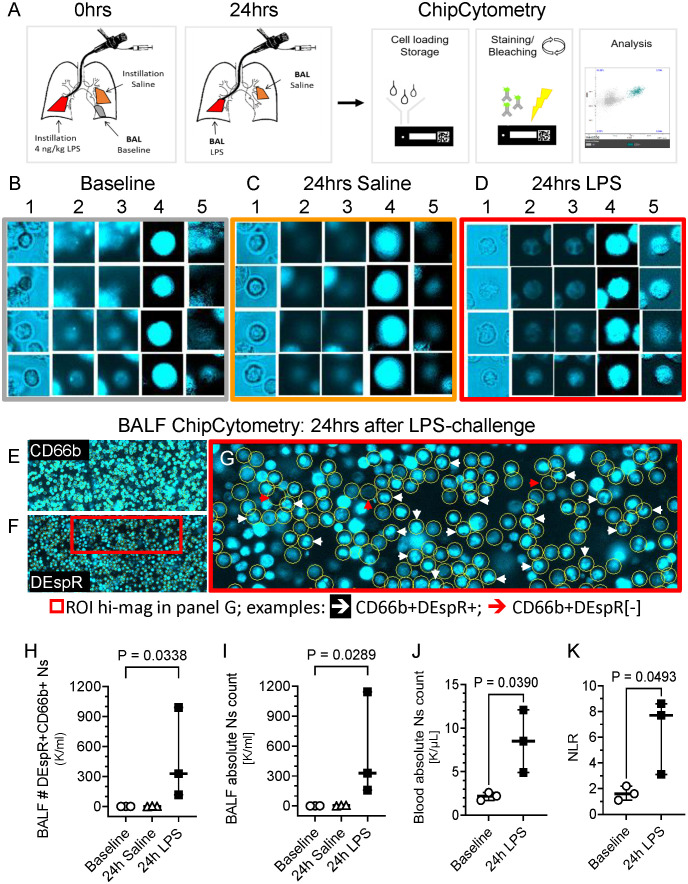
Figure 1.
Representative ChipCytometry detection of DEspR+CD66b+ neutrophils. (A) Diagram of ChipCytometry analysis in the segmental LPS-challenge model to obtain segment-specific human BALF cells at baseline (left lower lung), 24-hours after saline (right middle lobe) or LPS-challenge (left lingular lobe). (B-D) Representative ChipCytometry images from human healthy volunteers at baseline (B), in lung segments with saline instillation (C), and in lung segment with LPS-instillation (D). Columns represent: 1] transmitted light, 2] autofluorescence in phycoerythrin (PE) and 3] Alexa-Fluor (AF)488 channels, 4] CD66b-PE immunofluorescence after subtraction of PE-autofluorescence, 5] DEspR-AF488 immunofluorescence after subtraction of AF488-autofluorescence. Transmitted and fluorescence light images of four representative CD66b+ granulocytes are depicted for each. (E, F) Representative low magnification images of ChipCytometry, after subtraction of autofluorescence signals, showing CD66b+ neutrophils (E), and corresponding CD66b+DEspR+ neutrophils, wherein CD66b+ neutrophils are encircled (F). Red boxed region of interest (ROI) shown in panel G in higher magnification. (G) Representative image showing CD66b+ neutrophils (encircled in yellow) that are DEspR[-] red (↓) and DEspR+CD66b+ neutrophils with nuclear expression of DEspR white (↓). (H, I) Analysis of changes between baseline, 24-hours after segmental-saline and segmental-LPS challenge in BALF (H) number (#) of CD66b+DEspR+ neutrophils (Ns) and (I) BALF total # of neutrophils (Ns). (J, K) Analysis of changes between baseline and 24-hours (24h) post-segmental LPS-challenge in (J) peripheral absolute neutrophil (N) counts (K/μL) in HVs and in (K) peripheral neutrophil-to-lymphocyte ratio.

