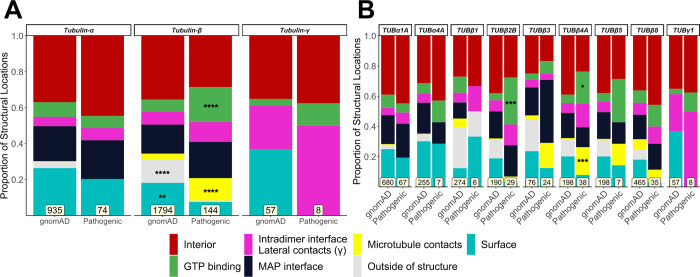
Fig 1. Comparison of the distribution of structural locations between pathogenic and putatively benign tubulin variants.
The proportion of pathogenic and putatively benign gnomAD mutations in each location type for tubulin-α, β and γ globally (A) and for individual isotypes (B). Mutation totals for each group are shown at the bottom, and only isotypes with at least five pathogenic mutations were included. Fisher’s exact tests were used to compare frequencies between gnomAD and pathogenic mutations considering each family and isotype separately. Asterisks indicate a location class with a significantly higher proportion of mutations compared to its corresponding group, where * p < 0.05, ** p < 0.01, *** p < 0.001, **** p < 0.0001.

