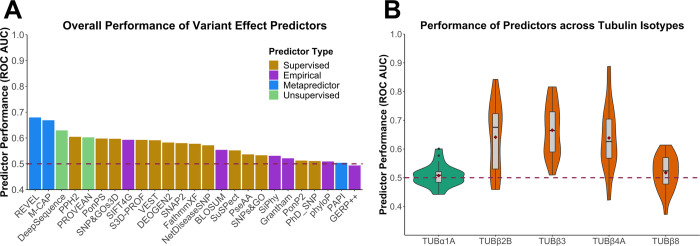
Fig 4. Assessment of VEP performance for identification of pathogenic tubulin mutations.
(A) ROC AUC values for each VEP across all tubulin-α and -β isotypes with at least one identified pathogenic mutation, colour coded according to predictor category. (B) Distribution of ROC AUC values across all VEPs for isotypes with at least 10 identified pathogenic missense mutations. Dashed line indicates the performance of a random predictor. Maroon diamonds indicate the mean area.

