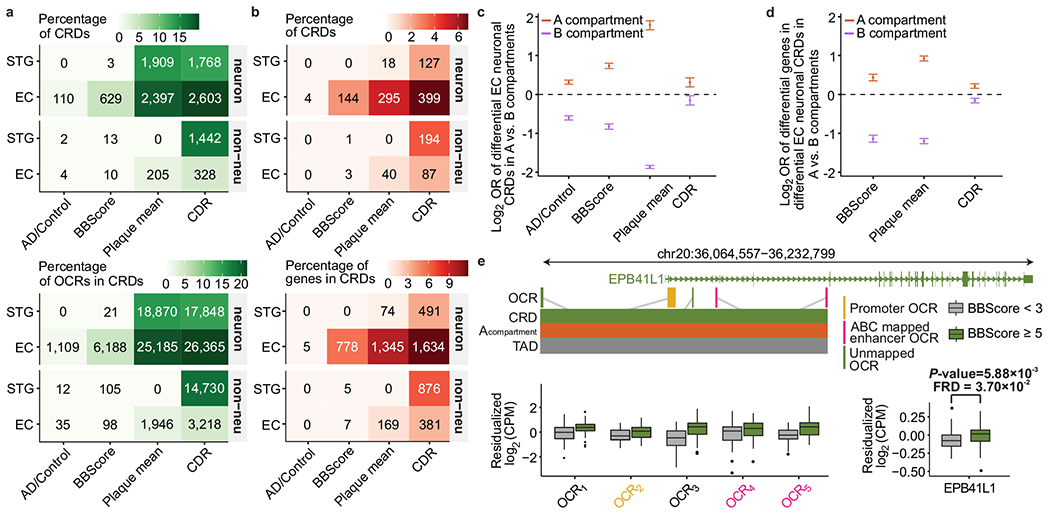
Fig. 8 |. Disease-associated perturbations in CRDs.

a, Counts of CRDs and OCRs within CRDs that are associated with AD-related phenotypes stratified by cell type and brain regions. b, Counts of CRDs and genes mapped to CRDs using the ABC model, that showed association with AD-related phenotypes in both epigenomic and transcriptomic levels using differential CRD test, stratified by brain region and cell type. c, Odds ratios of disease associated EC neuronal CRDs to be in A compartments vs. B compartments, measured for AD related phenotype: AD/Control: n=110 CRDs, P-value=5.25×10⁻³² (3.75×10−111); BBscore: n=629 CRDs, P-value=2.35×10−106 (1.15×10−128); Plaque mean: n=2,397 CRDs, P-value=2.37×10−199 (<10−200); CDR: n=2,603 CRDs, P-value=5.18×10⁻⁷ (1.30×10⁻²) in A(B) compartments. d, Odds ratios of disease associated genes in EC neuronal CRDs to be in A compartments vs. B compartments, measured for each AD related phenotype: 1) BBscore: n=778, P-value=6.17×10⁻²⁴ (5.0×10−142), 2) Plaque mean: n=1,345, P-value=1.3×10−181(1.3×10−282) and 3) CDR: n=1,634, P-value=6.58×10⁻¹³(9.93×10⁻⁷) in A(B) compartments. Odds ratios and P-values in c-d are estimated using two-sided Fisher’s exact test and error bars show upper and lower bounds of odds ratio at 95% confidence interval. e, Examples of changes in OCR expression (OCR1: P-value=4.20×10⁻⁴, FDR=5.67×10⁻²; OCR2: P-value=2.16×10⁻², FDR=2.56×10⁻¹; OCR3: P-value=5.26e×10−5, FDR=2.83×10⁻²; OCR4: P-value=3.08×10⁻¹ FDR=7.05e-1; OCR5: P-value= 2.59×10⁻⁴, FDR=4.8×10⁻²) and gene expression near the EPB41L1 gene (P-value=5.88×10⁻³, FDR=3.7×10⁻²) in BBScore associated CRD in EC neurons. P-values and FDR values were directly outputted from dream71. Box plot centered on median, bounds defined between the 25th and 75th percentile with minimum and maximum defined as median ± 1.5 × interquartile range, whiskers extending to the lowest/highest value within this range and potential outliers are shown as dots.
