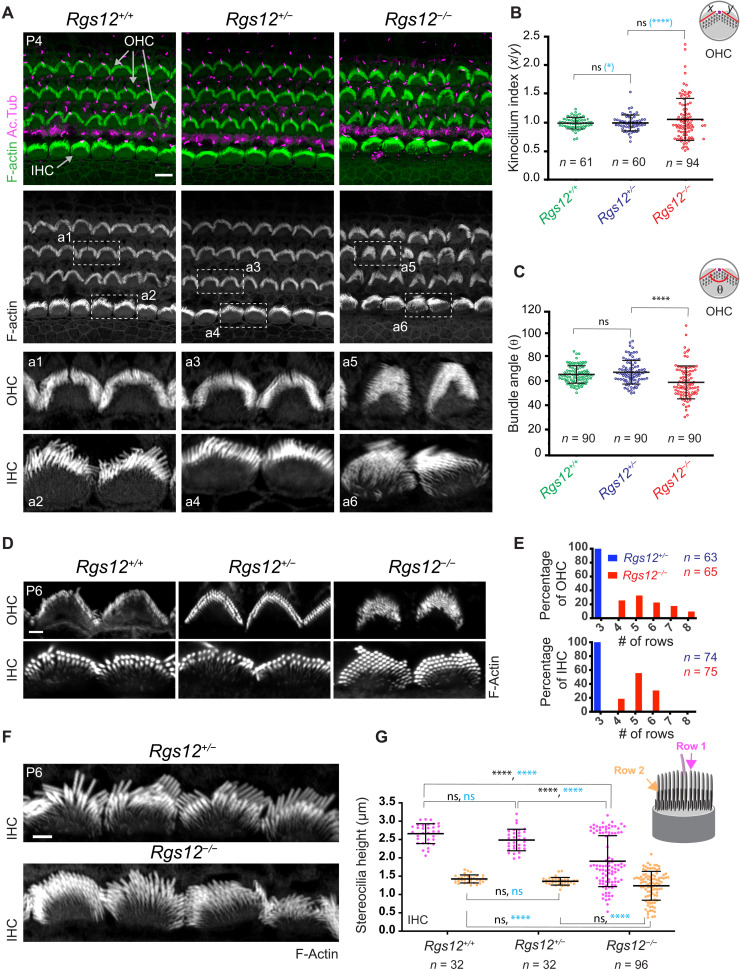
Fig. 2. Defective hair bundle morphogenesis in Rgs12 mutants.
(A) Surface views of the auditory epithelium (cochlear middle-turn, 50% position). F-actin is labeled with phalloidin, and acetylated tubulin (Ac.Tub) is immunolabeled to reveal primary cilia/HC kinocilia. Boxed regions are magnified at the bottom. Cochlear base and apex positions are shown in fig. S2 (A and B). (B and C) Kinocilium index (x/y ratio) (B) and angle (θ) (C) in OHC bundles. n = HCs, N = 3 animals. Means ± SD. Kruskal-Wallis with Dunn’s multiple comparisons to compare data distribution in black [ns (nonsignificant), P > 0.9999; ****P < 0.0001]. F test to compare variance in blue (B) (*P = 0.0157 and ****P < 0.001). (D and E) F-actin labeling shows extra stereocilia rows in Rgs12−/− OHCs and IHCs, as quantified by frequency distribution in (E). n = HCs, N = 3 animals. (F and G) F-actin labeling in IHCs (F) shows reduced stereocilia height in Rgs12−/− mutants as quantified in (G). n = stereocilia, N = 3 (Rgs12+/+; Rgs12+/−) or N = 4 (Rgs12−/−) animals, 8 (Rgs12+/+; Rgs12+/−) or 24 IHCs (Rgs12−/−), and 4 stereocilia per IHC per row. Means ± SD. Two-way analysis of variance (ANOVA) with Tukey’s multiple comparison for data distribution in black (row 1: ns, P = 0.2917; ****P < 0.0001; row 2: Rgs12+/+ versus Rgs12+/−, ns, P = 0.8438; Rgs12+/+ versus Rgs12−/−, ns, P = 0.1176; Rgs12+/− versus Rgs12−/−, ns, P = 0.3936). F test to compare variance in blue (row 1: ns, P = 0.6578; ****P < 0.0001; row 2: ns, P = 0.828; ****P < 0.0001). For all images in the study, the lateral/abneural side of the auditory epithelium is on top. Scale bars, 5 μm (A), 0.5 μm (D), and 1 μm (F).

