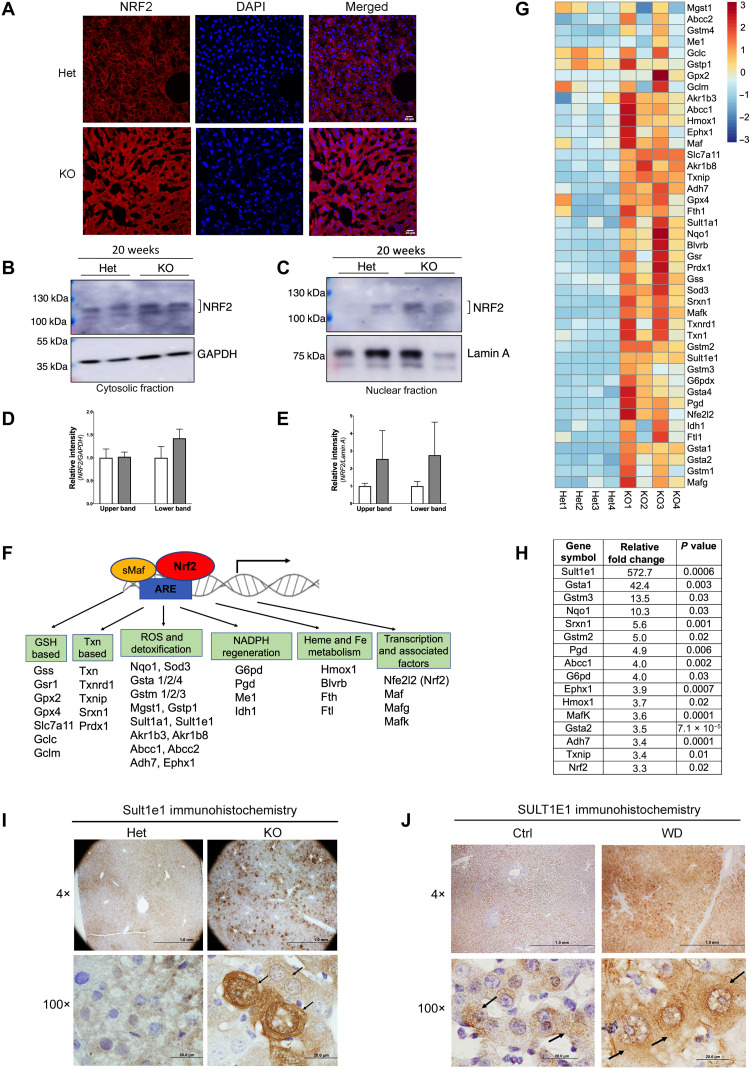
Fig. 1. Stress-sensitive NRF2 and NRF2 targets are up-regulated in Atp7b−/− mice.
(A) Immunostaining of NRF2 (red) in tissue sections revealed stronger signal in Atp7b−/− [knockout (KO)] liver compared to control [heterozygous (Het)]. DAPI (4′,6-diamidino-2-phenylindole; blue) marks nuclei. Scale bars, 20 μm. (B and C) Western blot analysis of cellular fractions shows enrichment of elevated NRF2 protein in nuclei. GAPDH (glyceraldehyde-3-phosphate dehydrogenase) (cytosol) and lamin A (nucleus) are loading controls. (D and E) Densitometry of NRF2 signal normalized to GAPDH and lamin A, respectively. (F) Diagram showing Nrf2 along with Mafs binding to antioxidant response element (ARE) and activating expression of their target genes. (G) Heatmap analysis of Nrf2-dependent transcripts was generated using R with row scaling and clustering of transcript abundances (positive value in red denotes up-regulation, whereas negative value in blue denotes down-regulation). (H) Most significantly changed Nrf2 targets; values represent relative fold change, n = 4 male mice per group. (I) Immunohistochemistry demonstrates up-regulation of Sult1e1 protein expression in Atp7b−/− hepatocytes (indicated by arrow in the high-magnification image). Scale bars, 1 mm and 20 μm; n = 3 male mice per group. (J) Immunohistochemistry of SULT1E1 in the WD patient liver sections shows strong SULT1E1 signal in hepatocytes as compared to healthy control (indicated by arrow in the high-magnification image). Representative image of SULT1E1 staining from the control and WD patient section that we have demonstrated here. Scale bars, 1 mm and 20 μm. n = 3 per group.

