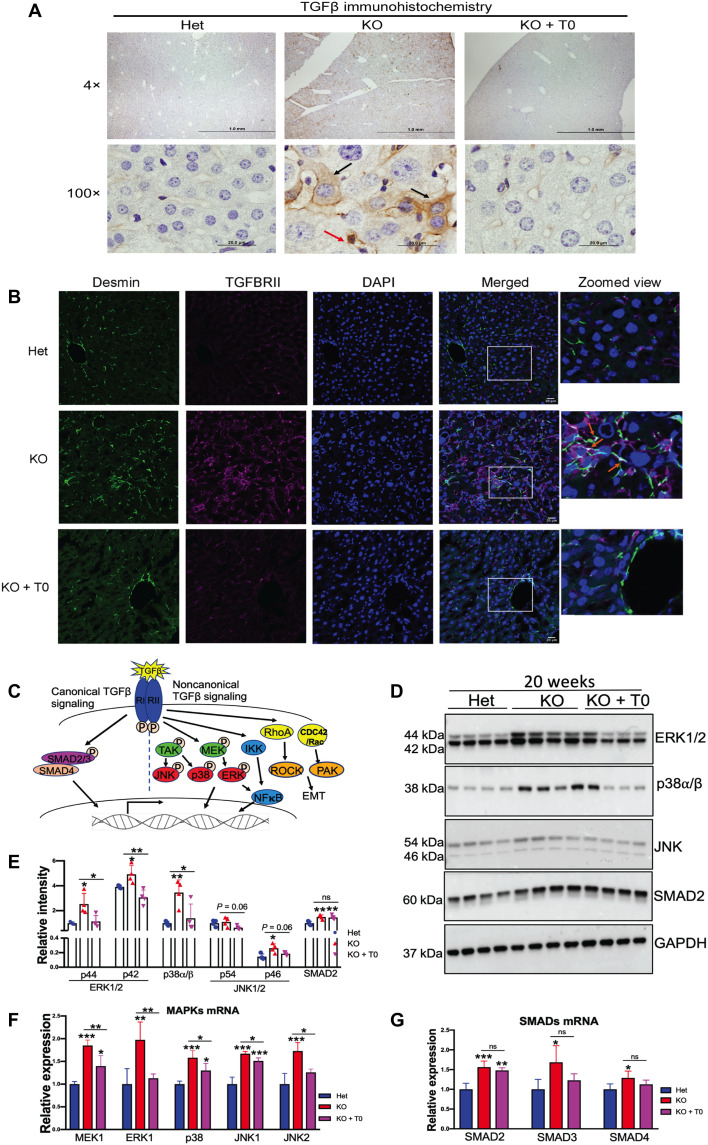
Fig. 6. LXR agonist reduces fibrosis in Atp7b−/− mice primarily via noncanonical TGFβ signaling.
(A) Representative immunostaining of TGFβ shows a significant increase in TGFβ signal in Atp7b−/− hepatocytes (black arrows) and nonparenchymal liver cell (red arrow). Scale bars, 20 μm. n = 3 male mice per group. (B) Activated stellate cell marker desmin (green) expression was significantly increased in KO mice and colocalized with the induced TGFβRII; zoomed view of areas marked by white quadrangle is shown on the right. Scale bars, 20 μm. (C) Diagrammatic representation of canonical and noncanonical TGFβ signaling pathways. (D) Western blots showing that MAPKs (ERK1/2, p38, and JNK1/2) and SMAD2 are elevated in KO tissues; activation of LXR reverses MAPK levels, whereas SMAD2 remains. GAPDH was used as an endogenous loading control. (E) Densitometry analysis of ERK1/2 (p44 and p42), p38, JNK (p54 and p46), and SMAD2 protein signals normalized to GAPDH. (F and G) MAPK mRNA (MEK1, ERK1, p38, JNK1, and JNK2) and SMAD (SMAD2, SMAD3, and SMAD4) mRNA expression induced in KO mouse liver compared to Het. LXR agonist reduced MAPK mRNA level; however, the drug does not affect SMAD2 to SMAD4 mRNA level in KO mice compared to untreated KO. Values represent means ± SD. *P < 0.05, **P < 0.01, and ***P < 0.001; n = 4 male mice per group. Blue color denotes Het, red denotes KO, and magenta denotes KO + T0, respectively.

