. 2022 Oct 3;11:e77073. doi: 10.7554/eLife.77073

Figure 1. B cell development in the bone marrow (BM) and spleen of Mb1-Cre Gen1−/− Mus81fl/fl mice.

(A, B) mRNA expression of Gen1 (A) and Mus81 (B) in developing and mature B cell subsets in the BM, spleen, and peritoneal cavity. FO: follicular, MZ: marginal zone (GEO Accession: GSE72018). (C) Spleens harvested from 4-month-old mice of the indicated genotypes. (D, E) Gating strategy (D) and absolute quantification (E) of live splenocytes, splenic B220+CD43–B, and B220+CD43+B cells. (F) Gating strategy of total B (B220+TCRβ–), total T (B220–TCRβ+), mature recirculating, immature, pro-B (fractions B and C), early pre-B (fraction C′), and late pre-B cells (fraction D). (G–I) Absolute quantification of BM cellularity, total B, and total T cell populations (G), of mature recirculating and immature B cell populations (H), and of B cell populations belonging to fractions B to D (I). Data in (E) and (G–I) are from four independent experiments with 18–22 mice per genotype. Bars display the arithmetic mean and error bars represent the 95% confidence interval of the measured parameters. P values were enumerated using ordinary one-way ANOVA analysis with Dunnett’s multiple comparisons test without pairing wherein all means were compared to the Mb1-Cre Gen1−/− Mus81fl/fl group. TPM, transcripts per million.

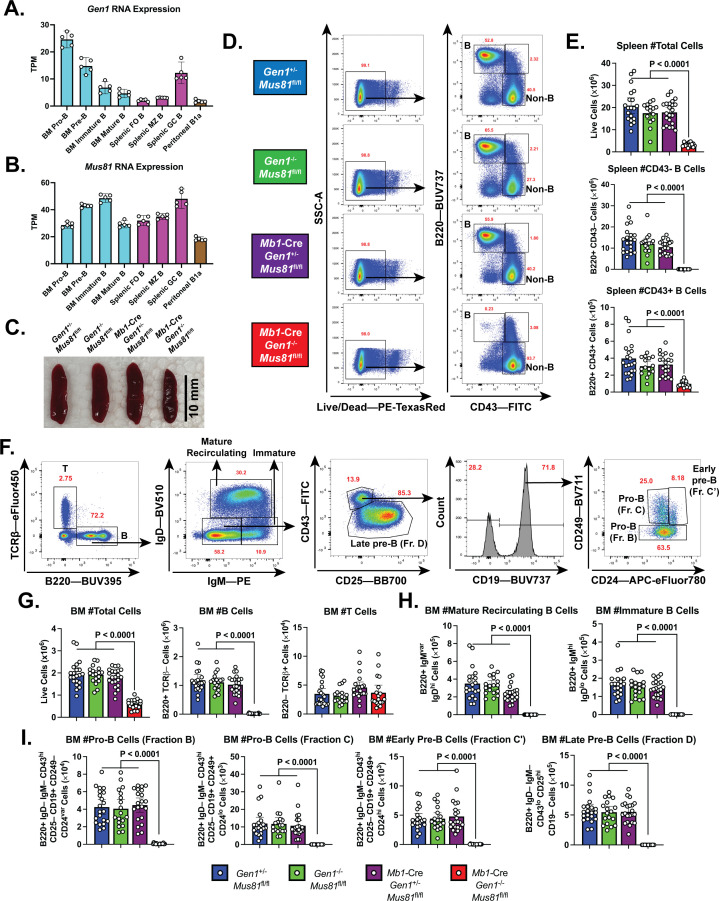
Figure 1.

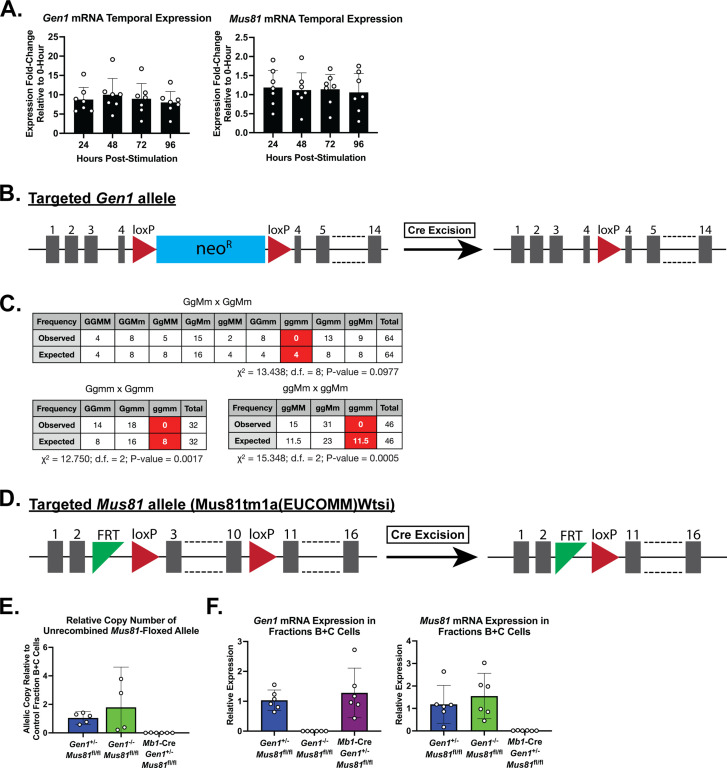
Figure 1—figure supplement 1. Temporal expression of Gen1 and Mus81, genetic structure of Gen1−/− and Mus81fl/fl alleles, Mendelian frequencies of Gen1−/− and Mus81−/− offsprings, and genotype validation of Gen1−/− Mus81fl/fl and Mb1-Cre Gen1+/− Mus81fl/fl pro-B cells.

Figure 1—figure supplement 1.

(A) Relative quantification of Gen1 and Mus81 mRNA transcript levels by RT-qPCR in wild-type mouse B cells stimulated in lipopolysaccharide (LPS)+interleukin-4 (IL-4) culture from 24- to 96-hr post-stimulation. The expression level of the transcripts was normalized to the 0-hr time point. (B) Schematic of gene-targeting in generating the constitutive Gen1−/− mouse model. The reading frame of exon 4 is disrupted with a floxed neomycin-resistance gene cassette that was subsequently excised upon Cre recombinase expression. (C) Tables depicting the observed and expected frequencies of the genotypes of pups generated from the indicated breeding schemes: G and M represent the wild-type alleles of Gen1 and Mus81, respectively, whereas g and m represent the null alleles of Gen1 and Mus81; d.f. denotes degree(s) of freedom. (D) Schematic of the Mus81fl/fl allele in which exons 3–10 are flanked by loxP sites. When Cre recombinase is expressed under a tissue-specific promoter, exons 3 through 10 are excised, generating a null allele. The FRT site is a remnant of a pair that previously flanked a lacZ reporter-neomycin selection cassette. (E) Copy number quantification relative to control (Gen1+/− Mus81fl/fl) of unrecombined Mus81fl/fl allele in fractions B+C cells isolated from the bone marrow of mice of the indicated genotypes. (F) Relative Gen1 and Mus81 mRNA expression in sorted fractions B+C cells. Data in (A) are from three independent experiments with seven mice per time point. Data in (E) and (F) are from two independent experiments with 4–6 mice per genotype.