. 2022 Oct 3;11:e77073. doi: 10.7554/eLife.77073

Figure 2. Homeostatic and induced GC responses in Cd23-Cre Gen1−/− Mus81fl/fl mice.

(A–C) Homeostatic GC response in mesenteric lymph nodes and Peyer’s patches. (A) Flow cytometric plots depicting the GL7+Fas+GC B cells in the Peyer’s patches of mice for each indicated genotype. (B, C) Quantification of the frequencies and absolute numbers of the GL7+Fas+GC B cell population in the mesenteric lymph nodes (B) and Peyer’s patches (C). (D–F) Evaluation of GC response during SRBC challenge. (D) Representative plots of the GL7+Fas+GC B cell population isolated from the spleen of mice immunized with SRBC for each indicated genotype. (E, F) Quantification of the frequencies and absolute numbers of GC B cells (E) and of total B cells (F) in the spleen of SRBC-immunized mice. (G, H) Assessment of induced GC response upon NP-CGG challenge in the Cd23-Cre Gen1−/− Mus81fl/fl mice at day 21 post-immunization. (G) Quantification of the percentage and absolute count of GL7+Fas+GC B cells in the spleen. (H) Frequencies and absolute numbers of live B220+ B cells in the spleen of PBS-treated and NP-CGG-immunized mice. Data in (B) and (C) are from four independent experiments with 11–21 mice per genotype. Data in (E) and (F) are from three independent experiments with 4–9 mice per genotype for the PBS group and 7–20 mice per genotype for the SRBC group. Data in (G) and (H) are from three independent experiments with 5–13 mice per genotype in the PBS group and 10–25 mice in the NP-CGG group. Bars represent the arithmetic mean and the error bars depict the 95% confidence interval of the measured parameters. For (B) and (C), p values were computed by ordinary one-way ANOVA analysis with Dunnett’s multiple comparisons test without pairing in which the means were compared to the Cd23-Cre Gen1−/− Mus81fl/fl group. For (E–H), ordinary two-way ANOVA analysis with Dunnett’s multiple comparisons test without pairing was used to calculate the p values. All means were compared within each treatment group to the Cd23-Cre Gen1−/− Mus81fl/fl cohort.

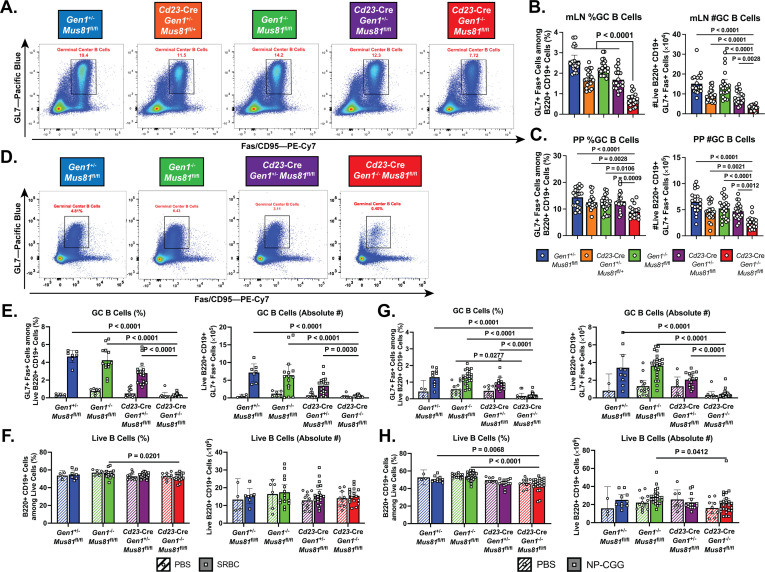
Figure 2.

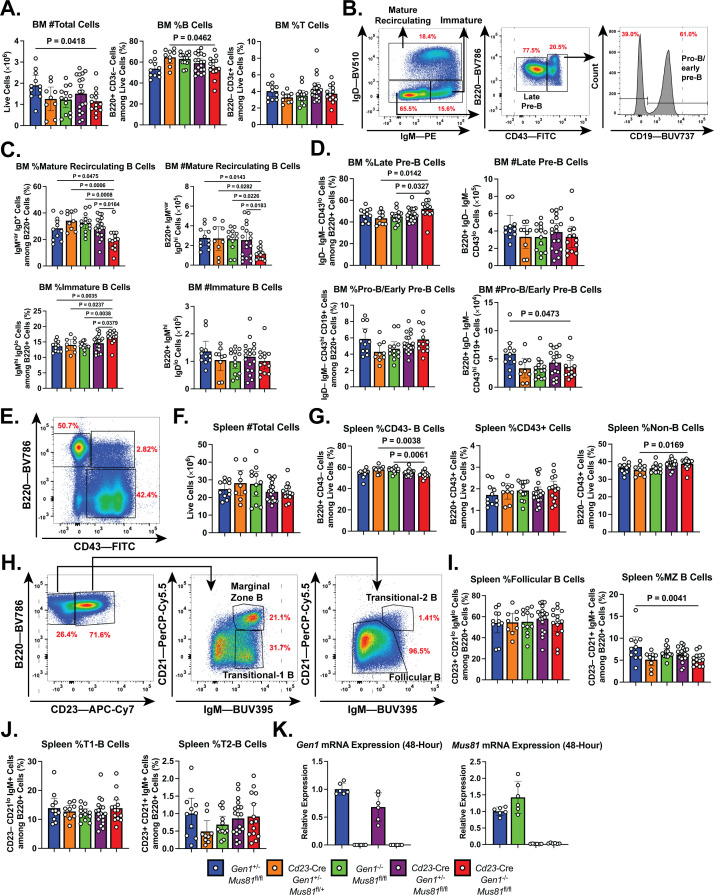
Figure 2—figure supplement 1. Steady-state phenotyping and quantification of the splenic and bone marrow (BM) B cell populations in the Cd23-Cre Gen1-/- Mus81fl/fl mice.

Figure 2—figure supplement 1.

(A) Quantification of BM cellularity and percentage of total B and T cell populations in the BMs of mice of the indicated genotypes. (B) Gating strategy of the B-cell populations in the BM: mature recirculating, immature, late-pre-B, and pro-B/early pre-B cells. (C) Quantification of the percentage among live B220+ B cells and absolute counts of mature recirculating and immature B cells. (D) Quantification of frequencies and absolute counts of late pre-B and pro-B/early pre-B cells among live B220+ B cells. (E) Representative flow cytometric plot depicting gating strategy of B220+CD43–B, B220+CD43+B, and non-B (B220–CD43+) cells in the spleen. (F, G) Quantification of the absolute number of live splenocytes (F), and of the percentage of splenic CD43–B, CD43+B, and non-B cells (G) in the mice of the indicated genotypes. (H) Gating strategy of the various splenic B cell subpopulations: marginal zone (MZ), follicular (FO), transitional-1 (T1), and transitional-2 (T2) B cells. (I) Frequencies of follicular and marginal zone B cells among total splenic B220+ cells. (J) Frequencies of T1 and T2 B cells among whole B220+B cells in the spleen. (K) Relative expression of Gen1 and Mus81 mRNA transcripts in LPS+IL-4-activated B cells of the indicated genotypes at 48 hr after stimulation. Data in (A–J) are from three independent experiments with 11–18 mice per genotype. Data in (K) are from three independent experiments with six mice per genotype. Bars depict the arithmetic mean and error bars represent the 95% confidence interval of the measured parameters. P values were calculated with ordinary one-way ANOVA analysis with Dunnett’s multiple comparisons test without pairing. All means were compared to the Cd23-Cre Gen1−/− Mus81fl/fl group.
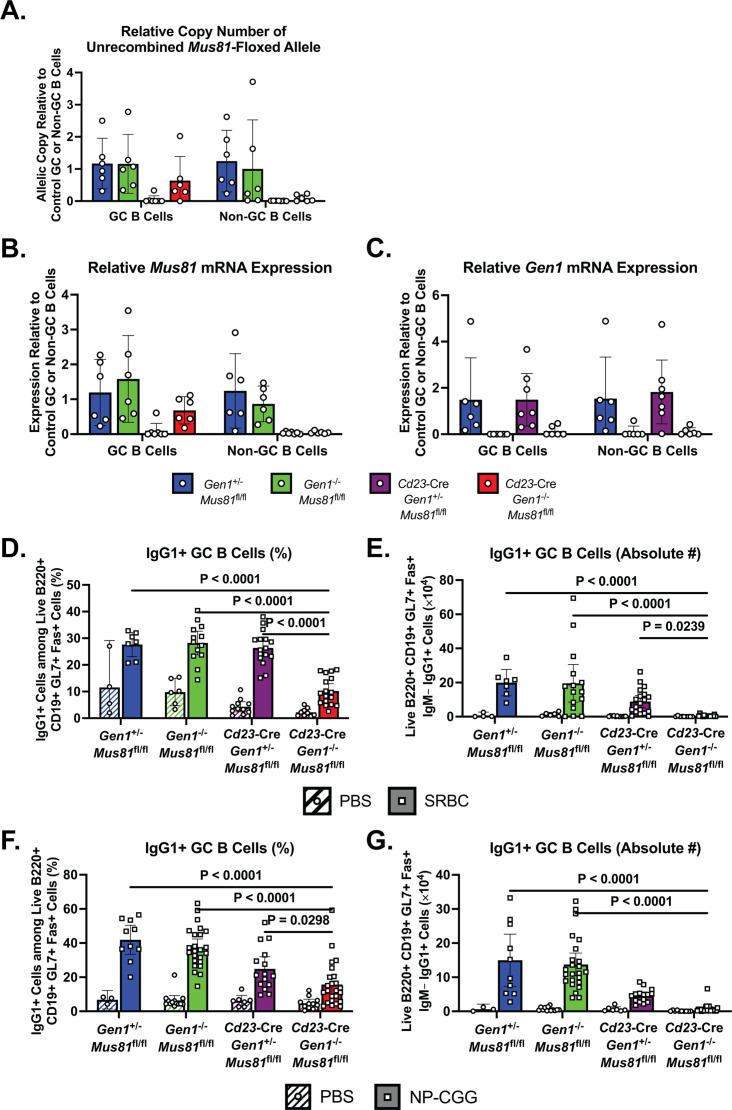
Figure 2—figure supplement 2. Assessment of Mus81 deletion efficiency in the germinal center by genomic qPCR and RT-qPCR analyses and examination of class switching in induced GCs in Cd23-Cre Gen1−/− Mus81fl/fl mice.

Figure 2—figure supplement 2.

(A) Quantification of the copy number relative to control (Gen1+/− Mus81fl/fl) of unrecombined Mus81fl/fl allele in GC and non-GC B cells sorted from the Peyer’s patches. (B, C) Relative measurement of Mus81 and Gen1 mRNA transcript levels in GC and non-GC B cells purified from the Peyer’s patches. (D–G) Quantification of the frequency and absolute number of IgG1-switched GC B cells in the spleen of SRBC-immunized mice (D, E) and in the spleen of NP-CGG-challenged mice (F, G). Data in (A–C) are from two independent experiments with 6–7 mice per genotype. Data in (D) and (E) are from three independent experiments with 4–9 mice per genotype for the PBS group and 7–20 mice per genotype for the SRBC group. Data in (F) and (G) are from three independent experiment with 5–13 mice per genotype in the PBS group and 10–25 mice in the NP-CGG group. Bars display the arithmetic mean and the error bars depict the 95% confidence interval of the measured parameters. Ordinary two-way ANOVA analysis with Dunnett’s multiple comparisons test without pairing was used to calculate the p values. All means were compared within each treatment group to the Cd23-Cre Gen1−/− Mus81fl/fl cohort.