. 2022 Oct 3;11:e77073. doi: 10.7554/eLife.77073

Figure 3. Growth, proliferation, cell cycle, and cell death profiles of ex vivo-stimulated DKO B lymphocytes.

(A) Growth curve of LPS+IL-4 (LI)-activated B cell culture. (B) Representative CTV dilution profiles of ex vivo-activated B cells at 0- and 72-hr post-stimulation for all indicated genotypes and culture conditions. (C) Frequency of live B220+ cells in each division. (D) Absolute number of undivided (division zero) cells after 72 hr of LI culture. (E) Class switching of B lymphocytes to IgG1 at 72- and 96-hr post-activation quantified as absolute number of live IgG1-expressing B cells. (F) Representative flow cytometry plots delineating the cell cycle stages of the cultured B cells based on EdU positivity and nuclear DNA content as determined by the intensity of DAPI staining. (G) Frequency of live B cells in G0/G1, S, and G2/M phases after 48, 72, and 96 hours of activation. (H) Fraction of dead cells among B220+ singlets at 72 and 96 hr after LI activation. (I) Percentage of cleaved caspase-3+ cells among live cells at 48-, 72-, and 96-hr post-stimulation. (J) Frequency of cleaved caspase-3+ cells among live B220+ cells in G0/G1, S, and G2/M phases after 48, 72, and 96 hr of culture. Data in (A) are from four independent experiments with nine mice per genotype. Data in (C) and (D) are from four independent experiments with 7–9 mice per genotype. Data in (E) are from seven experiments with 17 mice per genotype. Data in (G) are from six independent experiments with 11–12 mice per genotype. Data in (H) are from seven experiments with 17 mice per genotype. Data in (I) are from five independent experiments with 9–10 mice per genotype. Data in (J) are from three independent experiments with six mice per genotype. Bars display the arithmetic mean and error bars represent the 95% confidence interval of the measured parameters. P values were determined using ordinary two-way ANOVA analysis with Dunnett’s multiple comparisons test without pairing wherein the mean of the Cd23-Cre Gen1−/− Mus81fl/fl group was compared to the rest.

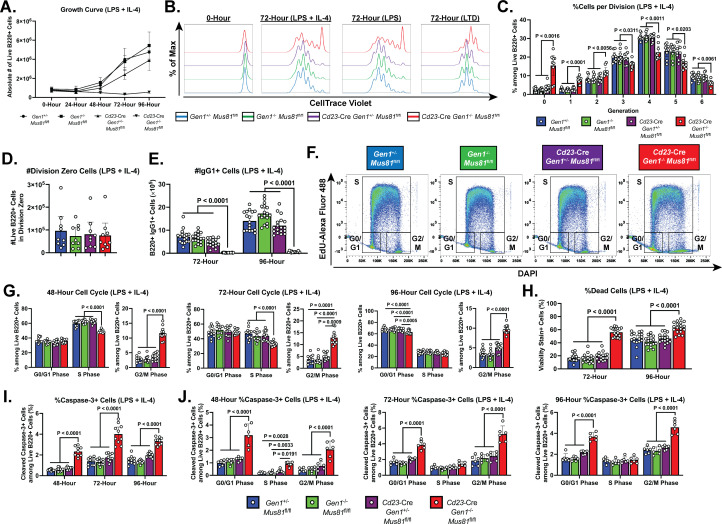
Figure 3.

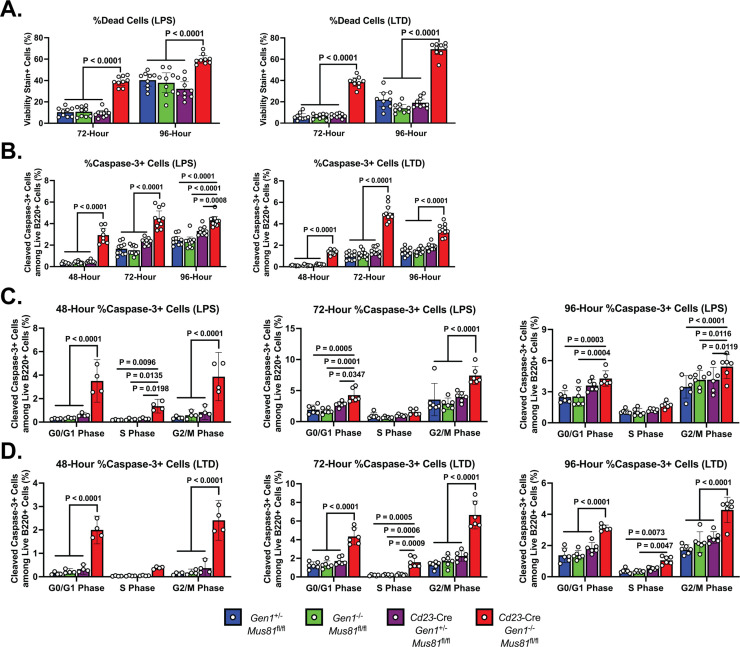
Figure 3—figure supplement 1. Ex vivo characterization of DKO cells following LPS and LPS+TGF-β+anti-IgD-dextran (LTD) stimulations.

Figure 3—figure supplement 1.

(A) Growth curve of LPS- and LTD-activated B cells. (B) Percentage of live B220+ cells in each division. (C) Absolute number of undivided (division zero) cells after 72 hr in LPS or LTD culture. (D) Class switching of B lymphocytes to IgG3 or IgA at 72- and 96-hr post-activation. Class-switched cells were quantified as absolute numbers of live IgG3- or IgA-expressing cells. (E, F) Cell cycle analysis of ex vivo-activated B cells. Frequency of cells among live B220+B cells in G0/G1, S, and G2/M phases at 48, 72, and 96 hr of LPS (E) or LTD (F) culture. Data in (A) are from four independent experiments with nine mice per genotype. Data in (B) and (C) are from three independent experiments with six mice per genotype. Data in (D) are from four independent experiments with nine mice per genotype. Data in (E) and (F) are from six independent experiments with 12 mice per genotype. Bars display the arithmetic mean and error bars represent the 95% confidence interval of the measured parameters. P values were determined using ordinary two-way ANOVA analysis with Dunnett’s multiple comparisons test without pairing wherein the mean of the Cd23-Cre Gen1−/− Mus81fl/fl group was compared to the rest.
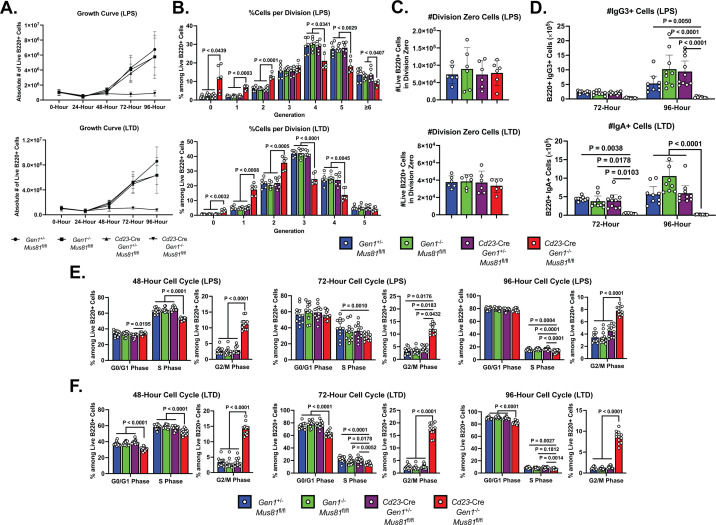
Figure 3—figure supplement 2. Cell death profiles of DKO cells stimulated in LPS and LTD cultures.

Figure 3—figure supplement 2.

(A) Frequency of dead cells quantified as percentage of B220+ singlets staining for the viability dye after 72 and 96 hr of culture in media with LPS or LPS+TGF-β+anti-IgD-dextran (LTD). (B) Apoptosis in ex vivo B cell cultures. Percentage of cleaved caspase-3+ cells within the live B cell population at 48-, 72-, and 96-hr post-stimulation. (C, D) Cell cycle-specific determination of apoptosis in ex vivo-activated B cells. Frequency of cleaved caspase-3+ cells among live B220+ cells in each phase at 48, 72, and 96 hr of LPS (C) or LTD (D) culture. Data in (A) are from four independent experiments with nine mice per genotype. Data in (B) are from five independent experiments with 8–10 mice per genotype. Data in (C) and (D) are from two (48 hr) or three (72- and 96-hr) independent experiments with 4–6 mice per genotype. Bars represent the arithmetic mean and the error bars depict the 95% confidence interval of the measured parameters. P values were calculated using ordinary two-way ANOVA analysis with Dunnett’s multiple comparisons test in which the means were compared to that of the Cd23-Cre Gen1−/− Mus81fl/fl cohort.